IS428 AY2019-20T1 Assign Chan Huang Suan Case
Contents
Challenge Question 1
1. Visualize radiation measurements over time from both static and mobile sensors to identify areas where radiation over background is detected. Characterize changes over time. Limit your response to 6 images and 500 words.
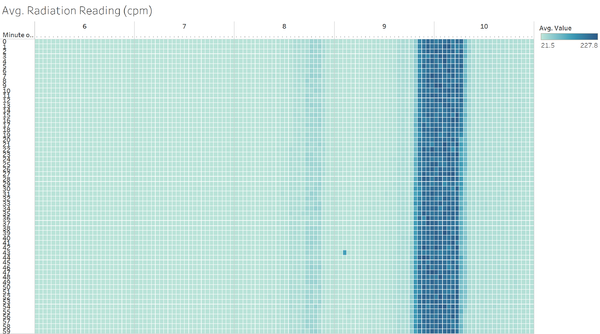
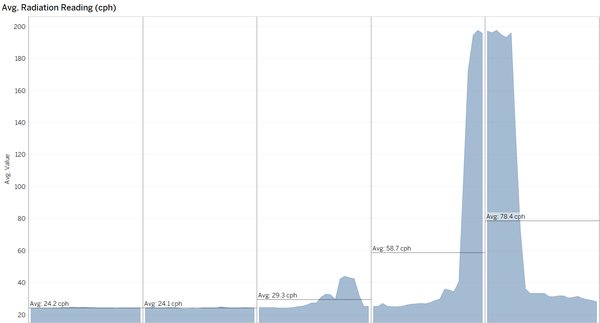
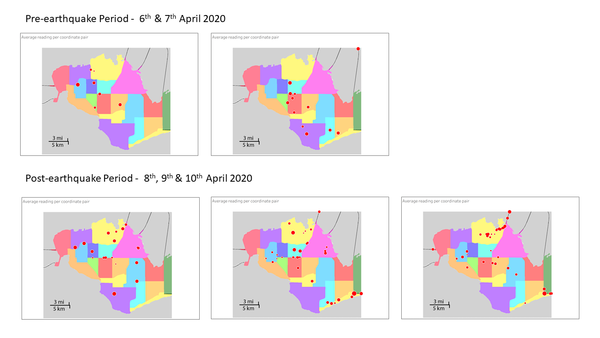
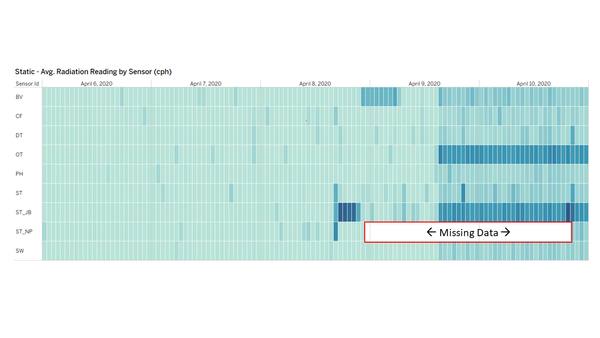
The average radiation reading observed across the 5 days can be categorized as Pre-Earthquake and Post-Earthquake. We observe 2 sections, Pre-Earthquake on the left from 6th April 2020 to 7th April 2020, and Post-Earthquake on the right from 8th April 2020 to 10th April 2020. We can visualize that average radiation reading increased significantly from 8th April 2020 onwards and there are obvious patterns in radiation readings between the Pre-Earthquake and Post-Earthquake periods. Thus, we can interpret that a large event happened on 8th April and 9th April 2020.
In the Pre-Earthquake period, the range of average radiation reading remained steadily at 24.2 counts per hour (cph). However, the range of average radiation reading increased sharply from 29.3 cph to 78.4 cph in the Post-Earthquake period.
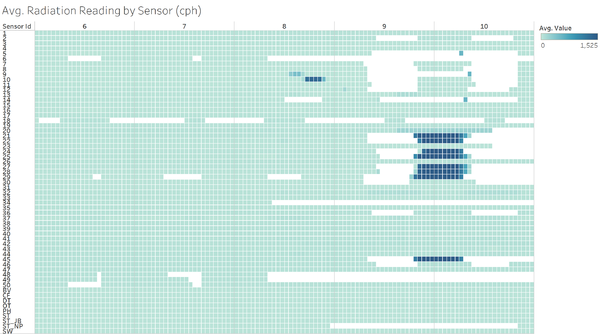
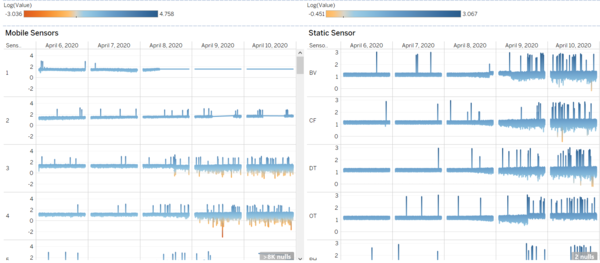
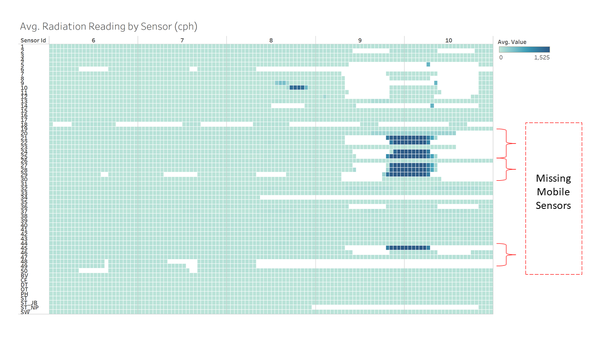
We see the above observations translate into the individual readings on some of the mobile sensors where significant spikes of average readings are monitored during the Post-Earthquake period.
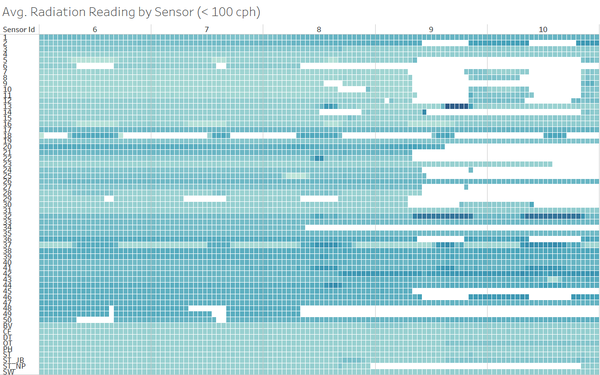
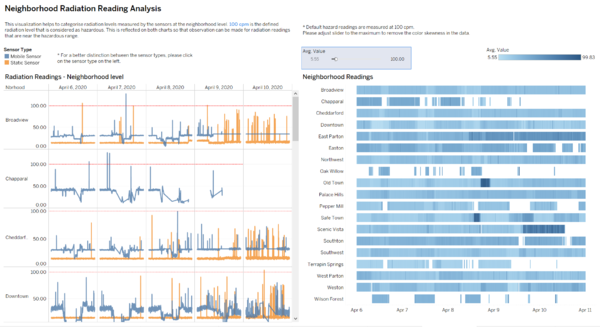
However, we can also observe that there is a different range of readings for each sensor when we remove radiation readings that are more than 100 cpm. This suggests that readings from various mobile sensors have a dependency on the location that they are in, and so there are different ranges of radiation readings in each region.
Challenge Question 2
2. Use visual analytics to represent and analyze uncertainty in the measurement of radiation across the city. Limit your responses to 12 images and 1000 words.
a. Compare the uncertainty of the static sensors to the mobile sensors. What anomalies can you see? Are there sensors that are too uncertain to trust?
Generally, it is observed that Static sensors readings are relatively more stable as compared to mobile sensors and demonstrated active uptime throughout the 5-day period of the observation.
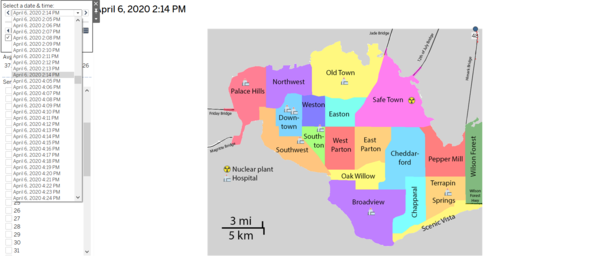
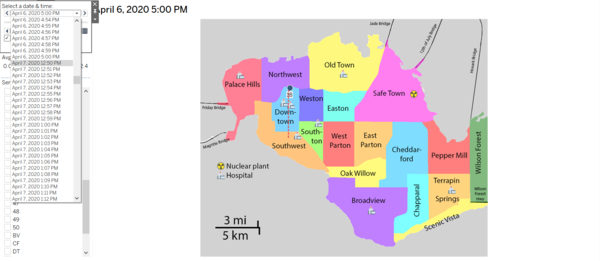
Mobile sensors are less reliable due to the external factors that affect the reading obtained. Based on the following examples, we can see that mobile sensors readings are less reliable because data are absent when the mobile sensors travel out of the town vicinity, are in areas with poor data connectivity or have a diversity of travel routes that are different across the 5 days. The following observation can be seen:
- In the left chart, Mobile Sensor 48 leaves the town vicinity at 2.14 pm and has no continued radiation reading.
- In the right chart, Mobile Sensor 18 reaches a point and stops. The next radiation reading continues on 7th April instead of continuing on 6th April 5.01 pm.
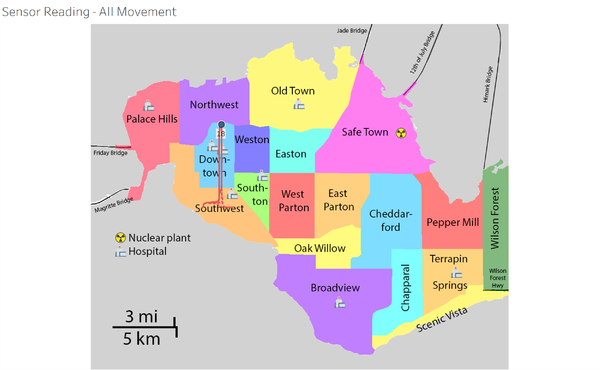
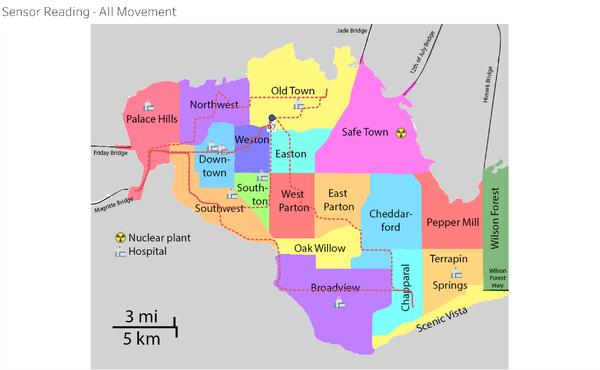
Mobile sensors, unlike static sensors, introduces movement data where we can observe traveling patterns across the 5 days period. Some mobile sensors tend to move within the same vicinity, whereas there are others that will roam around the town. This makes it difficult to ensure a consistent comparison of radiation levels across the town if we have to depend on mobile sensors alone. Mobile sensors 18 and 47 are examples that display this interesting behaviour as seen below.
It is noted that there are several sensors that were missing for unknown reasons, as data were absent after they traveled to a certain area in the town. Possible reasons that were suggested include sensors ran out of battery, faulty sensor and sensors being damaged from weather conditions.
- Mobile Sensor 6: 8th April 2020 onwards
- Mobile Sensor 34: 8th April onwards. Went missing in East Parton.
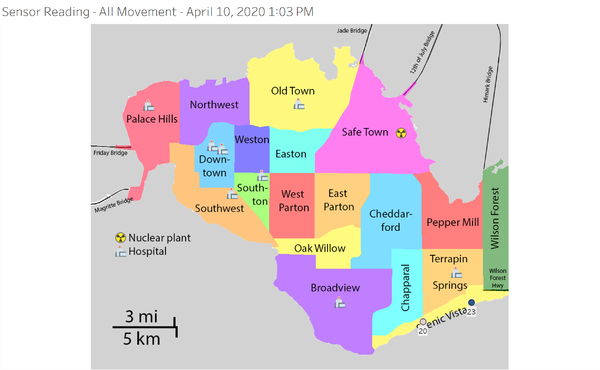
- Mobile Sensor 20: 10th April 2020 onwards. Went missing in Scenic Vista. Shown below.
- Mobile Sensor 23: 10th April 2020 onwards. Went missing in Scenic Vista. Shown below.
Due to traveling patterns, different mobile sensors also experienced a wider range of radiation readings as compared to static sensors. We observe that there is more fluctuation in radiation reading levels for the mobile sensors when compared to static sensors in the Pre-earthquake period. This observation can be seen in the following screenshots.
b.Which regions of the city have greater uncertainty of radiation measurement? Use visual analytics to explain your rationale.
By looking at the neighborhood radiation reading analysis table, we can visually identify that there are areas where there is a greater uncertainty of radiation measurement.
1. Insufficient observation from sensors
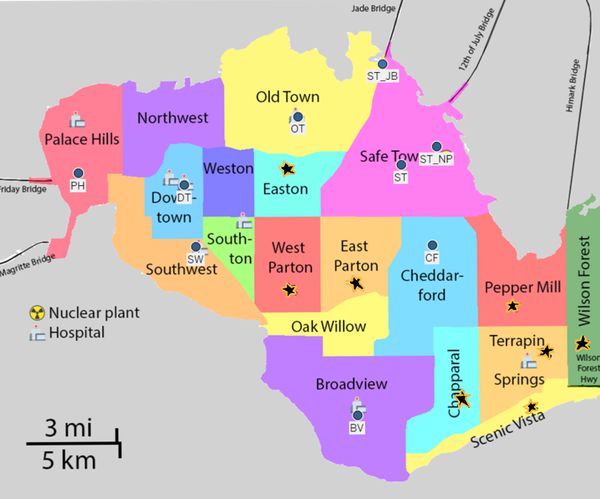
Neighborhoods like Chapparal, Oak Willow, Pepper Mill, Terrapin Springs and Wilson Forest are areas where radiation readings are relatively fewer than the other neighborhoods. We observe that there are large period of time spanning days, where no static and mobile sensor were able to provide radiation reading for that particular neighborhood. This increases the uncertainty because we are unable to gain an understanding for the situation at the location due to the lack of data.
2. Unavailablility of sensor
In some neighborhood where there is an absence of a static sensor, we observe that there are only mobile sensor providing the radiation readings. This creates gaps when there could be no mobile sensor in the area within a time period, and thus no radiation readings were observed. Hence, this creates an uncertainty in radiation levels for that neighborhood.
c. What effects do you see in the sensor readings after the earthquake and other major events? What effect do these events have on uncertainty?
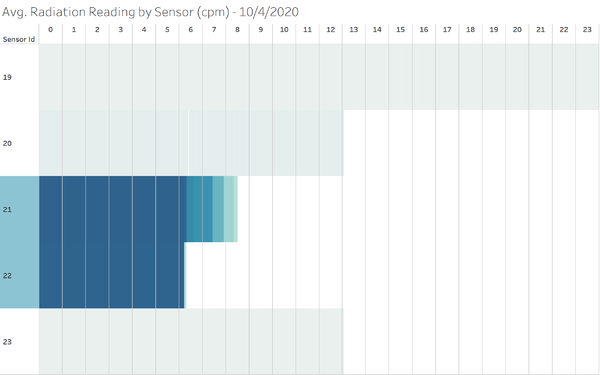
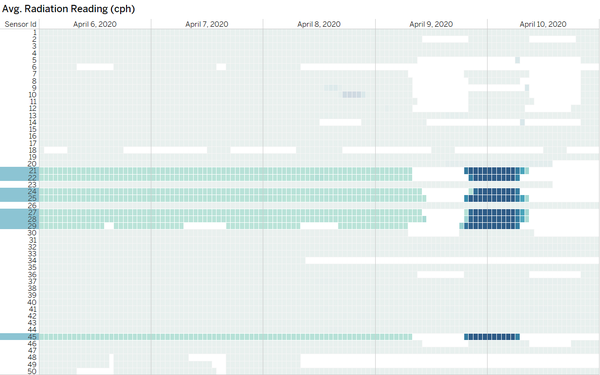
Firstly, we observe that there is a significant increase in the range of average radiation levels for both static and mobile sensors. This can be seen from the chart below where there were higher radiation readings after 5 pm on 8th April 2020 and a spike in radiation from 8 pm on 9th April 2020 to 6 am on 10th April 2020.
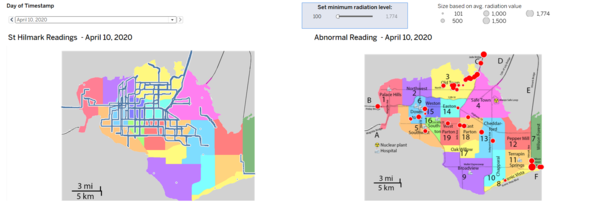
Secondly, we observe an increase in abnormal radiation readings in areas where there weren’t abnormal radiation readings prior to the earthquake. We can visualize this change when we compare the abnormal readings spots from 6th April 2020 to 10th April 2020.
Thirdly, we observe that there is a major decrease in mobile activity in the southern regions when comparing readings between Pre-Earthquake and Post-Earthquake. This is evident as there are no mobile sensors that provided readings that point to the southern coordinates on 10th April 2020.
Challenge Question 3
3. Given the uncertainty you observed in question 2, are the radiation measurements reliable enough to locate areas of concern? Limit your responses to 10 images and 1000 words
a. Highlight potential locations of contamination, including the locations of contaminated cars. Should St. Himark officials be worried about contaminated cars moving around the city?
Based on the visual movement of mobile sensors, there are several mobile sensors that have been exposed to radiation for a prolonged period of time. For distinction purposes, I will be assuming that contamination has occurred if a mobile sensor is experiencing a phenomenon where the radiation reading has an abnormal increase over time when compared between Pre-earthquake and Post-earthquake period. In the other case, an exposure has occurred if a mobile sensor was in contact with abnormally high radiation readings for any duration, but returned to its usual average radiation readings.
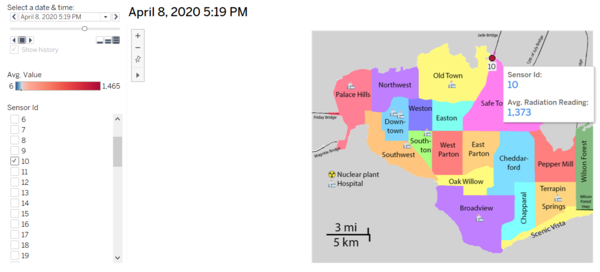
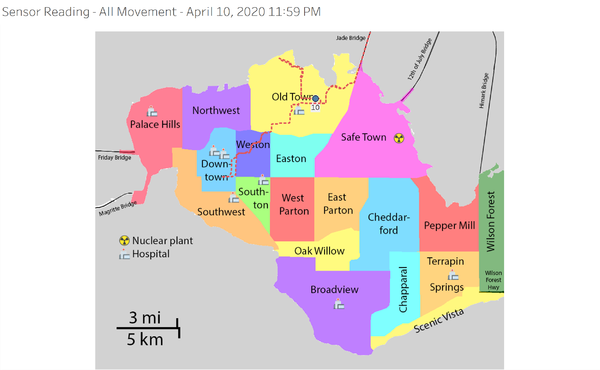
The first observation made is at Jade Bridge entrance where Mobile Sensor 10's average radiation reading was at 12 cpm in the Pre-earthquake period. On 8th April 2020, Mobile Sensor 10 recorded an abnormally high radiation reading of 1,000 cpm where it stayed for 4hrs from 5 – 9 pm before returning back to Old Town. This mobile sensor is the first to be contaminated because the sensor's average radiation reading increased 2 times more than its observed usual reading at 20 cpm.
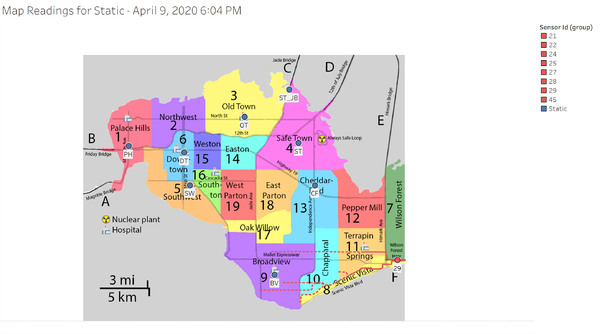
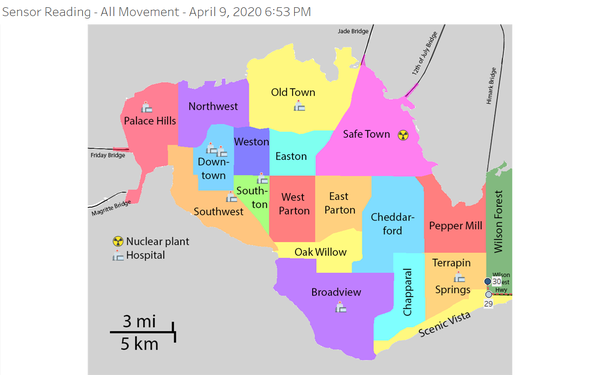
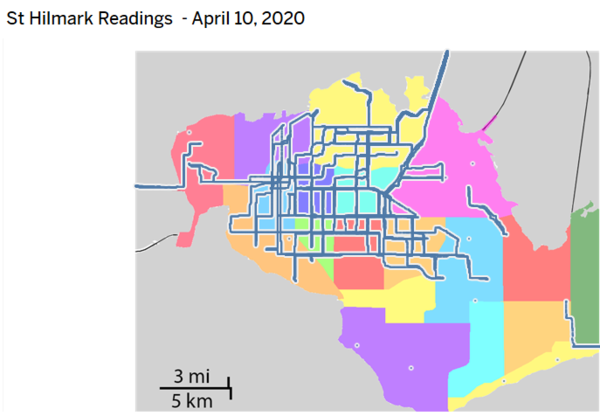
The second observation is shown in the chart above, we see that there are several mobile sensors that monitored high radiation readings from 6 pm onwards. From the St Hilmark Sensor Movement visualization, we see that there is a cluster of mobile sensors positioned at the entrance of Wilson Forest Highway. These mobile sensors remained at the location from 9th April 2020, 8 pm to 10th April 2020 7 am. It would suggest that the sensors were exposed for a prolonged period of time and have the possibility of being contaminated given that the radiation readings continued to be high as it left the town vicinity. It also suggests that Wilson Forest could have been affected by the radiation leak.
The third observation is visualized from the abnormal readings spots chart as shown above. In the St Hilmark Town description, it is documented that there is renovation work on having Old Town’s water supply line being replaced. We also note that the Always Safe Nuclear Plant is powered by water. Hence, there are reasons to suggest that the radiation could have impacted Old Town due to the radiation leakage through the water pipes. This would also link to the first observation as to why there is a surge in radiation reading at Jade Bridge.
St Hilmark officials do not need to be worried about contaminated cars moving around the city. The above screenshot showcase that Mobile Sensor 30 passed by the clusters of mobile sensors that were situated at Wilson Forest Highway Entrance. Mobile sensor 30 did not show that it was contaminated even though it passed by the group. This is also true for Mobile 10, where radiation readings were not affected by other mobile sensors that drove near. Hence, there is no indication that suggests a contaminated car can spread radiation to others.
b. Estimate how many cars may have been contaminated when coolant leaked from the Always Safe plant. Use visual analysis of radiation measurements to determine if any have left the area.
Based on the analysis above, we estimate that there is a total of 8 contaminated mobile sensors. They are mobile sensors 21, 22, 24, 25, 27, 28, 29 and 45. From the congregation at Wilson Forest Highway, the 8 mobile sensors stayed overnight and were exposed to a prolonged period of high radiation level measured at around 1,500 cpm. The mobile sensors left the town vicinity starting from 6.20 am on 10th April 2020, with mobile sensors 21 and 25 being the last few to leave the area at 8.30 am. Mobile sensor 10 is another contaminated sensor. However, we observe that mobile sensor 10 left the town vicinity in the afternoon only to return in the evening and roam around Old Town. On 10th April 2020, the mobile sensor also roamed around Weston and Downtown.
c. Indicate where you would deploy more sensors to improve radiation monitoring in the city. Would you recommend more static sensors or more mobile sensors or both? Use your visualization of radiation measurement uncertainty to justify your recommendation.
In terms of reliability, static sensors would provide more consistent data overall. Hence, I would deploy more static sensors to monitor the radiation levels throughout the town. However, we understand that the main weakness of static sensors would be the inability to roam around town which could potentially identify radioactive areas that are not covered by the static sensors. I would suggest that we deploy static sensors to all regions that do not have a static sensor. This includes regions such as Northwest, Weston, Southon, Easton, West Parton, East Parton, Oak Willow, Pepper Mill, Chapparal and Wilson Forest. A static sensor provides readings for the entire day where it is deployed to for as long as it is operational. Unlike static sensors, mobile sensors hugely rely on the human travel pattern and as such, it leaves gaps in radiation reading where there will be times when there is no mobile sensor in a region due to travel patterns as highlighted in Question 2A.
Based on the abnormal readings visualization, we can observe that there are a lot of high radiation level spots in the southern part of the town from 9th to 10th April 2020, where there are no available sensors to monitor the radiation readings in the area. This creates a lot of uncertainty with regards to the impact and the spread of the radiation leaked in neighborhoods such as Chapparal, Terrapin Springs, Pepper Mills, Scenic Vista and Wilson Forest. These are areas where having a static sensor would help to detect high radiation spots.
Challenge Question 4
4. Summarize the state of radiation measurements at the end of the available period. Use your novel visualizations and analysis approaches to suggest a course of action for the city. Use visual analytics to compare the static sensor network to the mobile sensor network. What are the strengths and weaknesses of each approach? How do they support each other? Limit your response to 6 images and 800 words.
The visualization above shows that there is a significant number of mobile sensors that have gone missing by the end of the Post-earthquake period. Many observations have shown that the mobile sensors left the town vicinity and has not returned. On average, we can observe that there is an increase in the overall radiation readings when comparing the Pre-earthquake and Post-earthquake periods.
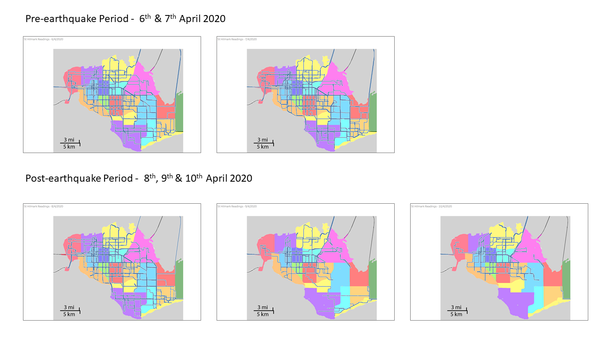
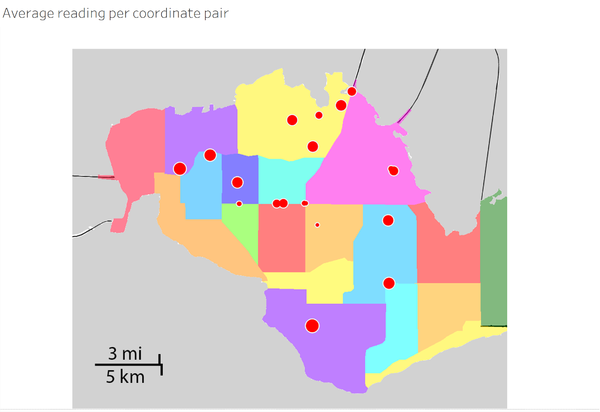
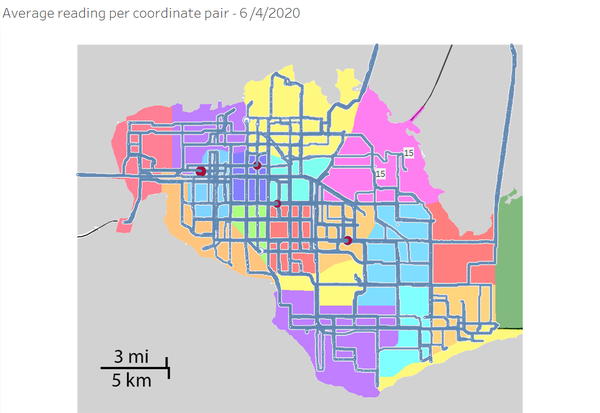
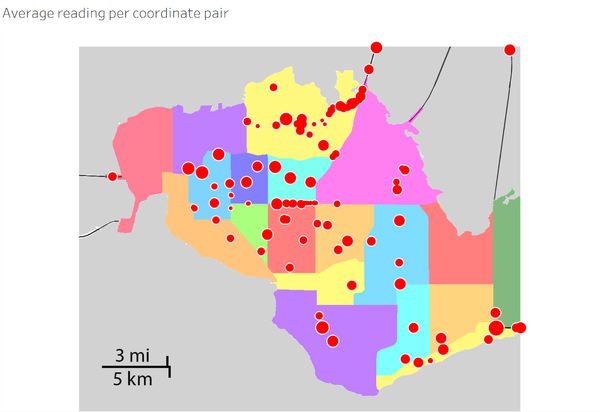
By plotting the values with the coordinates provided by both static and mobile sensors, we are able to visualize the radiation values that were measured at the particular coordinates pair. The objective is to identify areas with sporadic high radiation levels using the average radiation readings that were measured for each day. The below example shows all the routes where the static and mobile sensors transmitted a radiation reading.
The blue points are coordinate points that measured a relatively low average radiation reading whereas the red points are coordinates points that measure a relatively high average radiation reading. Unfortunately, the blue points are very distracting to be used for analysis. Hence, a filter is used to show an only average reading of more than 100 cpm. This will allow us to focus on areas with abnormally higher readings.
By looking at the screen above, we see that regions with high radiation readings are in the central of the town such as Downtown, Weston, Southon, Easton, West Parton and East Parton. In the north, Old Town is a region that experienced a spike in the number of hotspots which suggests that there are contaminated cars leaving the town through the Jade Bridge. This behavior is also observed in the southern parts such as Scenic Vista and Chapparal where contaminated cars could have left by the Wilson Forest Highway. It would be important for the Government and Emergency officials to investigate the suspected areas of radiation contamination such as Old Town, Jade Bridge, and Wilson Forest which were identified as the first areas of contamination.
As discussed in previous answers, there are strengths and weaknesses in using the different types of sensors.
| Static Sensor Strength | Static Sensor Weakness | Mobile Sensor Strength | Mobile Sensor Weakness |
|---|---|---|---|
|
|
|
|
The sensors complement one another. The static sensors are relatively more expensive than mobile sensors, and hence it is more economical to deploy a mass number of mobile sensors. The mobile sensors are more mobile and can travel to the neighborhood where the static sensors are not installed in, thus providing more coverage where the static sensor lacks. With the combination of both sensors, we would be able to get a complete picture of the events that happened in St Hilmark.
However, there are drawbacks to the use of both sensors as well. In the scenario, as observed in St Hilmark on 8th and 9th April 2020, the earthquake has affected both sensors and has shown the weakness of both sensors. We observed that the Static Sensor at Always Safe Nuclear Plant was not operational on 8th April 2020, whereas Mobile Sensors steered clear from affected neighborhoods and thus, there were no proper radiation readings in the affected southern parts of St Hilmark. These are examples where neither sensors were able to provide a clear picture of what happened in St Hilmark.
Challenge Question 5
5. The data for this challenge can be analyzed either as a static collection or as a dynamic stream of data, as it would occur in a real emergency. Describe how you analyzed the data - as a static collection or a stream. How do you think this choice affected your analysis? Limit your response to 200 words and 3 images.
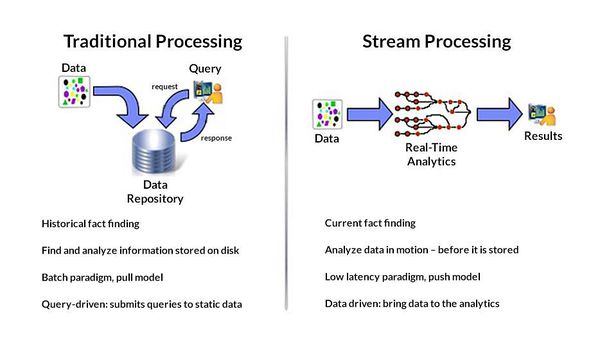
For this challenge, I would prefer that the data be collected as a stream. The reasons to suggest are as such:
- Static and Mobile sensors have the capability to transmit real-time radiation readings.
- Data observations are compared based on a rolling time window with the latest data records against past data records.
- Emergency situations require data transmission to have the least latency in the order of seconds or milliseconds instead of hours.
I believe that I will be able to analyze the results instantly and be able to report and respond to an abnormal radiation reading immediately in a real case scenario.

