IS428 AY2019-20T1 Assign Benedict Then Ji Xiang Visualisations
|
|
|
|
|
|
Dashboard: Mobile & Static Sensor(s) radiation readings and locations
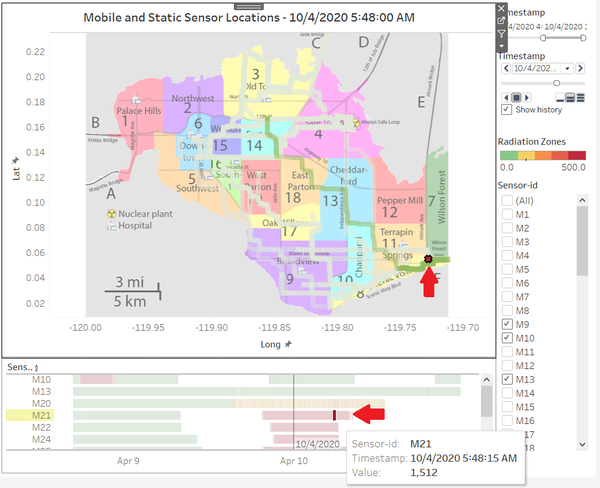
Purpose of this dashboard is to be able to do a cross-reference between a sensor's radiation readings and its location at that point or period of time. This allows readers to select a specific or range of time period for sensor and able to see where it was located at that point or period of time.
- Map: Shows the map of St'Himark along with the Static/Mobile Sensors location and its radiation level. (Green/Yellow/Orange/Red)
- Timestamp Range filter: filter/edit the range of the time period of the 4 days
- Time-Lapsed filter: plays the time-lapsed of the radiation reading and location of the sensors. In addition, able to adjust the speed and show the trails of the movement of the sensors.
- Radiation Levels: Green shows that radiation levels are low/normal, Yellow: small areas of radiation readings, Orange/Red: dangerous levels of radiation readings.
- Sensor-ID filter: filter to show which static or mobile sensor to be seen on the map and timestamp.
- Timestamp chart: shows the radiation readings of the selected sensor over the time period of the major events.
For example, by selecting a particular timestamp (10/4/2020 5:48:15 AM) of a Sensor which is this case is Mobile Sensor 21, we will be able to see the location of it at that point of time. In addition, we can also see its trail from 9/4/2020 to 10/4/2020 as filtered by the timestamp range filter at the top right of the dashboard. We can see how convenient this dashboard is for doing cross-reference of radiation reading, timestamp and location of sensors.


