IS428 AY2019-20T1 Assign Ng Kai Ling Bernice
Contents
Problem & Solution
Problem
After major events like earthquakes hits St. Himark, the nuclear power plant suffers damage resulting in a leak of radioactive contamination. Further, a coolant leak sprayed employees’ cars and contaminated them at varying levels. Therefore, the need to help St. Himark’s emergency management team combine data from the government-operated stationary monitors with data from citizen-operated mobile sensors and data visualizations to help them better understand conditions in the city and identify likely locations that will require further monitoring, cleanup, or even evacuation.
Solution
Below are the list of data visualization developed:
- Overview: Gives users an overview of how much radiation the town or area has on the particular day.
- Area of Contamination: Allow users to identify location of concern and car contamination.
Dataset Transformation
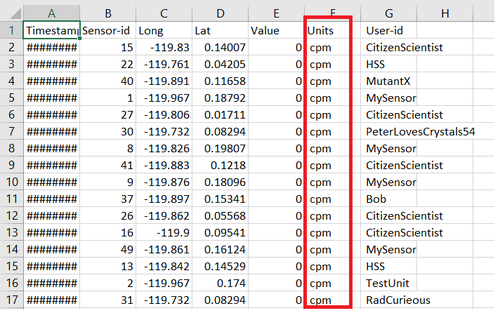
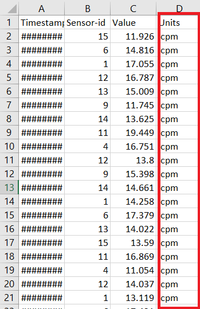
Removing Redundant Data

