IS428 AY2019-20T1 Parth Goda Rajesh
Background
Welcome to St. Himark! A fictional city that will is being used in this visual case study. It is a city of 19 neighborhoods, all of which have their unique characteristics and amenities. St. Himark has a population of 246,839 people and it's located in the Oceanus Sea. It is also home to the world-renowned St. Himark Museum, beautiful beaches, and the Wilson Forest Nature Preserve. It is one of the best cities to raise a family and work. Always Safe Nuclear Power Plant provides the majority of the power in the city and jobs in the Safe Town. Mayor Jordan and the city council current govern the city.
The runs in the following utilities:
- Water and Sewage
- Road and Bridge
- Gas
- Garbage
- Power
There is always construction going on in the above utilities.
St. Himark is segregated into 19 neighborhoods:
- PALACE HILLS
- NORTHWEST
- OLD TOWN
- SAFE TOWN
- SOUTHWEST
- DOWNTOWN
- WILSON FOREST
- SCENIC VISTA
- BROADVIEW
- CHAPPARAL
- TERRAPIN SPRINGS
- PEPPER MILL
- CHEDDARFORD
- EASTON
- WESTON
- SOUTHTOWN
- OAK WILLOW
- EAST PARTON
- WEST PARTON
Problem
There was an earthquake northwest of St. Himark. It occurred between 6 April 2020 and 8 April 2020. The city's officials needed to collect data immediately to understand the extent of the damage. Then can then allocate resources efficiently to the areas of town where it's needed and dispatch their emergency services.
At first, they only have the seismic readings of the earthquake and used that for their first round of dispatch. Now, however, they need more information to get a better gauge of what is going on on the ground level.
Purpose
To gather the information the city official's need. They launched an app where the citizens can report the intensity of shake and level of damage done to utility infrastructure. The officials can use this tool to record data provided by citizens. The citizens use the app to note down the level of damage seen on a utility/infrastructure building in a Neighbourhood. They can also record the shake intensity in the neighborhood. The data is stored every 5 mins. They may also be some data loss or delay due to power shortages.
With all this data, visualizations were created to understand the data faster. Recommendations and decisions can be churned out faster to get help to people faster.
Data Gathering and Clean up
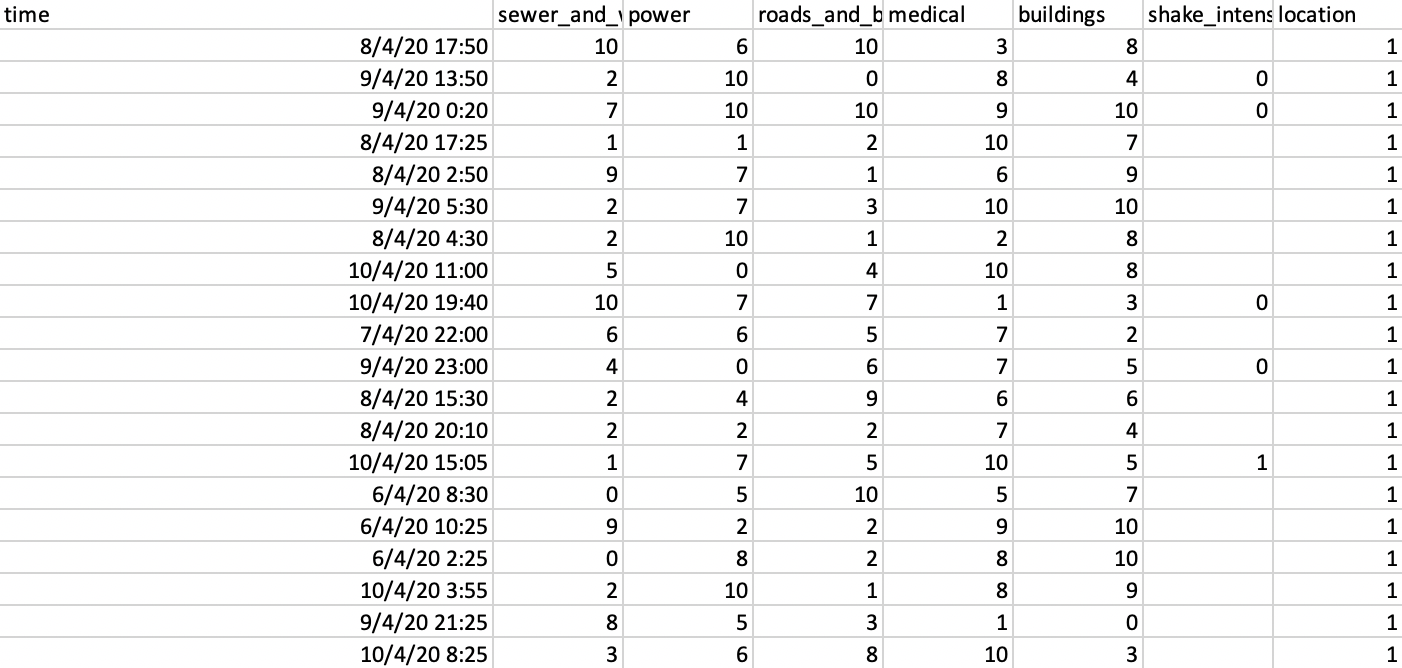
The data provided in a CSV file with the following data:
