IS428 AY2019-20T1 Assign Lim Pei Xuan: Visualization
Walkthrough
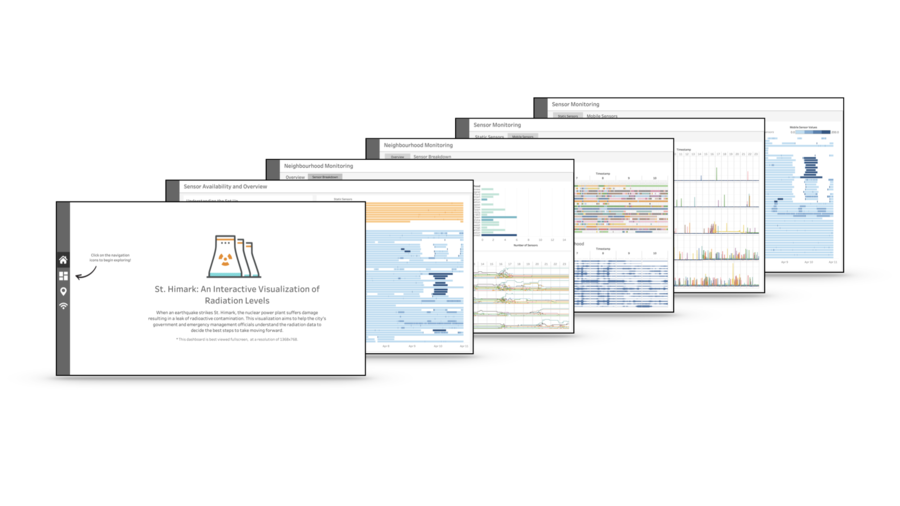
The final interactive visualization consists of a few linked Dashboards organised as follows:
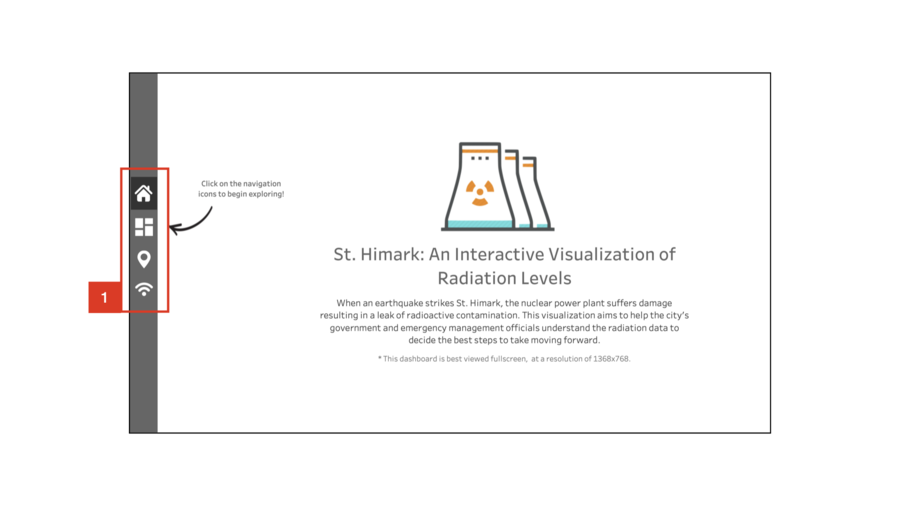
- Home
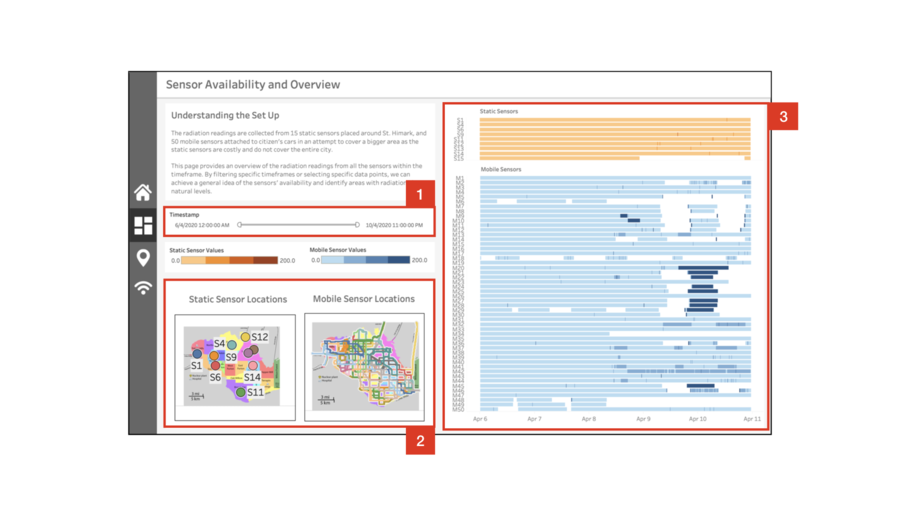
- Sensor Availability and Overview
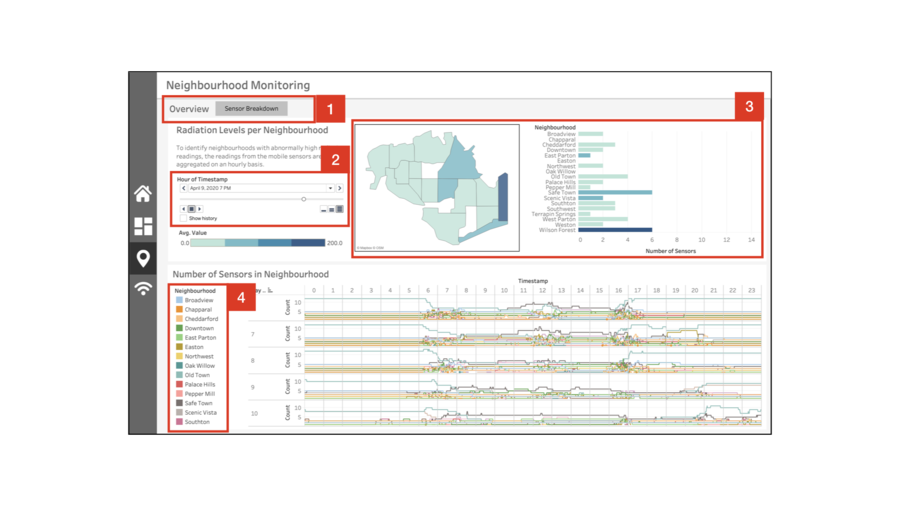
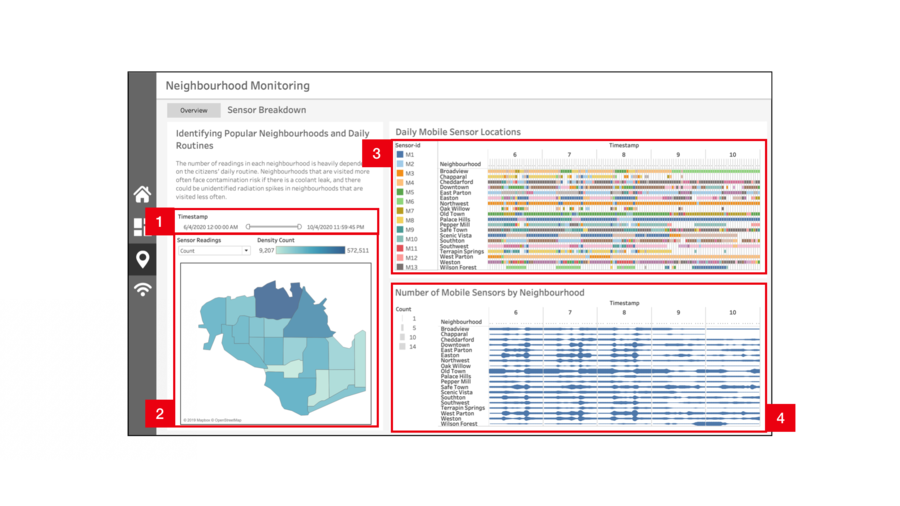
- Neighbourhood Monitoring
- Overview
- Sensor Breakdown
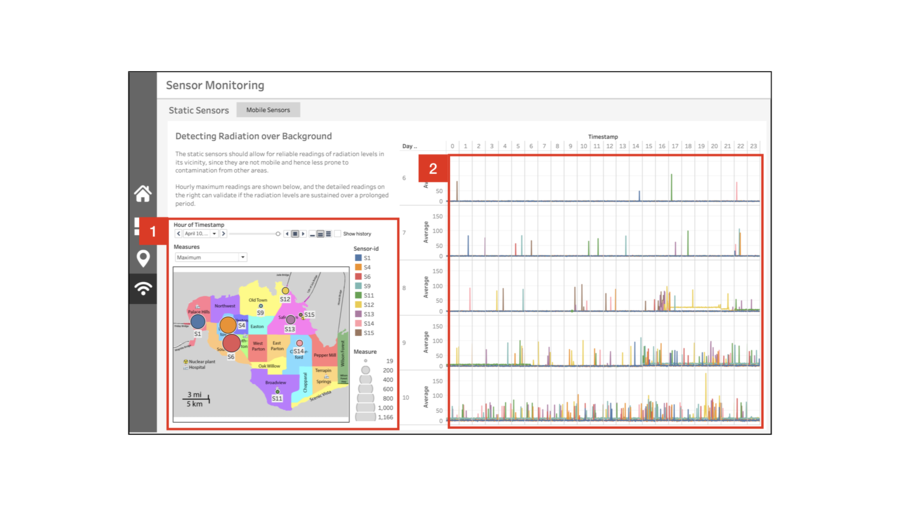
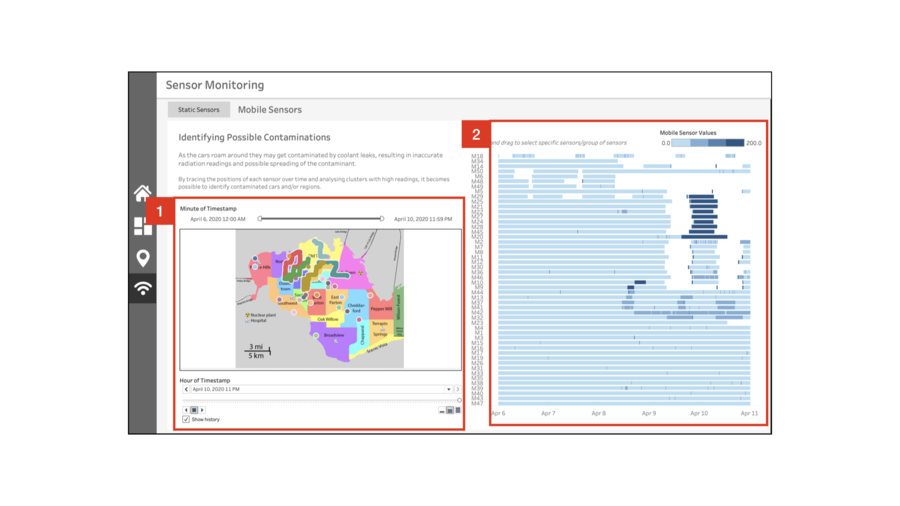
- Sensor Monitoring
- Static Sensors
- Mobile Sensors
The dashboard is organised such that the user will begin with a rough overview of the data, followed by a gradual deep dive into the details of the data. This is to facilitate understanding and prevents the user from getting too overwhelmed by chaotic nature of the data.
| No. | Description |
|---|---|
|
1 |
Blablabla |
| No. | Description |
|---|---|
|
1 |
Blablabla |
|
2 |
Blablabla |
|
3 |
Blablabla |
| No. | Description |
|---|---|
|
1 |
Blablabla |
|
2 |
Blablabla |
|
3 |
Blablabla |
|
4 |
Blablabla |
| No. | Description |
|---|---|
|
1 |
Blablabla |
|
2 |
Blablabla |
|
3 |
Blablabla |
| No. | Description |
|---|---|
|
1 |
Blablabla |
|
2 |
Blablabla |
| No. | Description |
|---|---|
|
1 |
Blablabla |
|
2 |
Blablabla |

