IS428 AY2019-20T1 Assign Benedict Then Data Preperations
Revision as of 20:47, 11 October 2019 by Jxthen.2017 (talk | contribs)
MINI CHALLENEGE 2: VISUALIZATION OF ALWAYS SAFE NUCLEAR POWER PLANT
Datasets
4 datasets will be used for VAST 2019 - Mini Challenege 2:
- StaticSensorReadings.csv - contains Static Sensor radiation measurements at different timestamp
- StaticSensorLocations.csv - contains the location of Static Sensors
- MobileSensorReadings.csv - contains Mobile Sensor radiation measurements and cordinates at different time stamp
- MC1-Reports-Data.csv - contains citizens reports of shaking/damage by neighborhood over time
Objectve
The objective is to combine StaticSensorReadings.csv, StaticSensorLocations.csv, MobileSensorReadings.csv into one csv file so that it will be easier to analyze on Tableau. In addition, do some data cleaning on the current datasets provided.
Data Preperations
| Step 1 | Combining StaticSensorReadings.csv and StaticSensorLocations.csv |
|---|---|
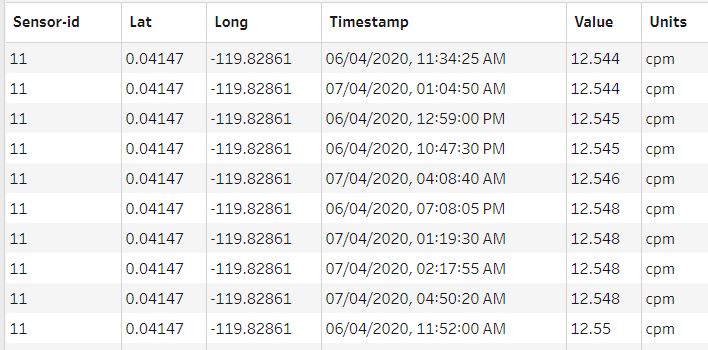
| Description | Currently, StaticSensorReadings.csv only contains the Static Sensors radiation measurements while StaticSensorLocations.csv only contains the location of the Static Sensors. Both of these csv files will be combined into one by inner-joining the Sensor_ID field so that every Static Reading will have its known coordinates. |
| Illustration |
