Difference between revisions of "IS428-AY2019-20T1 Climate Vizards: Proposal - Others"
Jump to navigation
Jump to search

Wendyng.2015 (talk | contribs) |
Wendyng.2015 (talk | contribs) |
||
| Line 60: | Line 60: | ||
<br/> | <br/> | ||
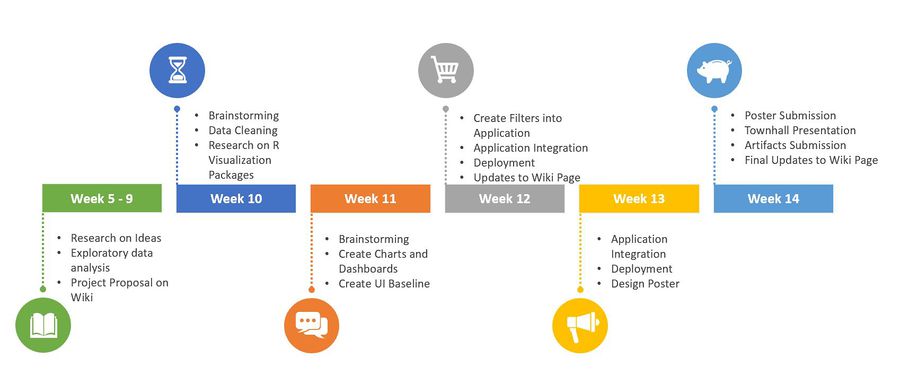
| − | + | =Timeline= | |
<p>[[File:Schedule.jpg|900px|frameless|border|left]] </p> | <p>[[File:Schedule.jpg|900px|frameless|border|left]] </p> | ||
| − | + | =Challenges= | |
{| class="wikitable" | {| class="wikitable" | ||
|- | |- | ||
Revision as of 17:32, 13 October 2019

Climate Vizards
|
|
|
|
|
|
|
|
|
|
|
|
|
Timeline

Challenges
| Challenges | Proposed solution |
|---|---|
| Using Rshiny | Diligently complete the lessons in datacamp |
| Building complex visualisation such as spatial interpolation | Read up early and start trying at an earlier stage of the project as it will require time |
| Getting the Singapore's temperature and rainfall data | Diligently download the data by month and location |