Difference between revisions of "IS428 AY2019-20T1 Assign Chan Huang Suan Processing"
Hschan.2016 (talk | contribs) |
Hschan.2016 (talk | contribs) |
||
| Line 110: | Line 110: | ||
</p> | </p> | ||
<p> | <p> | ||
| − | <b> Solution: </b> By borrowing concepts from database normalization, we can create a key-value pair that corresponds Sensor ID with User ID. By creating a separate list, we can reduce the amount of data in the excel file. This file is then extracted as a Mobile ID List. | + | <b> Solution: </b> By borrowing concepts from database normalization, we can create a key-value pair that corresponds Sensor ID with User ID. By creating a separate list, we can reduce the amount of data in the excel file. This file is then extracted as a Mobile ID List for future reference if necessary. |
</p> | </p> | ||
Latest revision as of 16:29, 13 October 2019
Before the analysis began, the dataset given is analysed to identify its respective format and attributes. This section will elaborate on the dataset analysis and transformation process for each dataset in order to prepare the data for import and analysis on interactive visualization.
Upon opening the project files, we can see:
| File name | Image | Purpose |
|---|---|---|
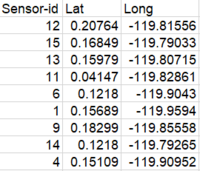
| Static Sensor Location | Lists static sensor's geographic coordinates | |
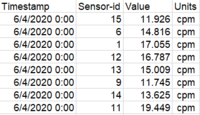
| Static Sensor Readings | Lists static sensor's radiation reading values at a 5 second interval | |
| Mobile Sensor Readings | Lists mobile sensor's radiation reading values at a 5 second interval, with coordinates. Note: There are more rows that exceeds the Excel limit when we open the file. | |
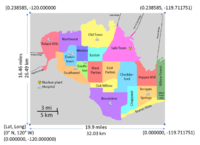
| St Hilmark Map & Coordinates | An image file showcasing St Hilmark's neighborhood and its landmarks. There is a St Hilmark .shp file that plots geometry for each neighborhood. |
Contents
Tableau Prep
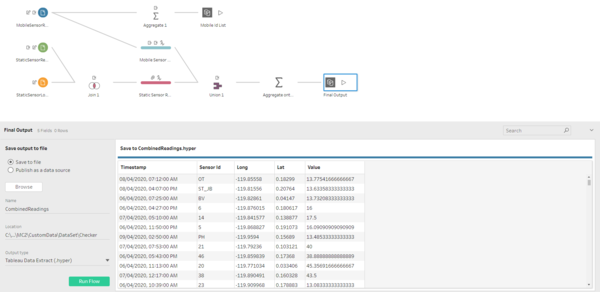
In tableau prep, the objective is to merge the files of both Static and Mobile Sensor together. This will help to reduce the load to perform table-joining operations Tableau Desktop, hence effectively boosting performance. Based on the white paper shared by Tableau, we understand that .hyper extension output file helps to boost performance. Hence, the project will leverage this tableau technology to enhance performance.
Tableau Prep Steps:
| Description | Screenshot |
|---|---|
| 1. Import all 3 excel files into Tableau Prep | N.A |
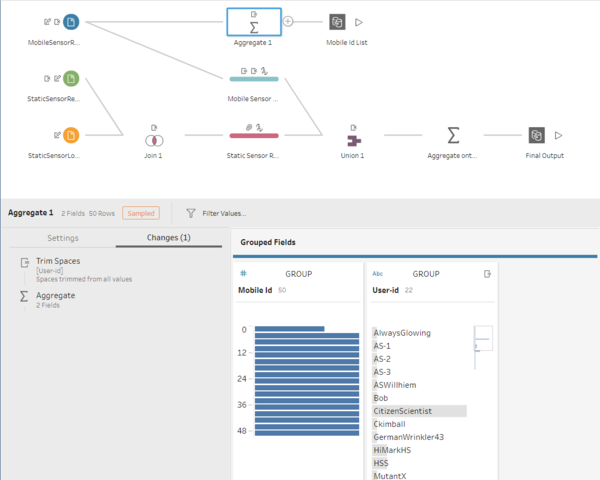
| 2. Aggregate Mobile Sensor ID to create a list of key-value pair for Mobile ID & User ID | |
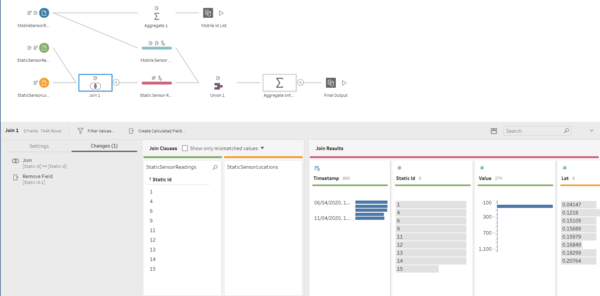
| 3. Inner Join Static Sensor Reading and Static Sensor Location based on Static ID | |
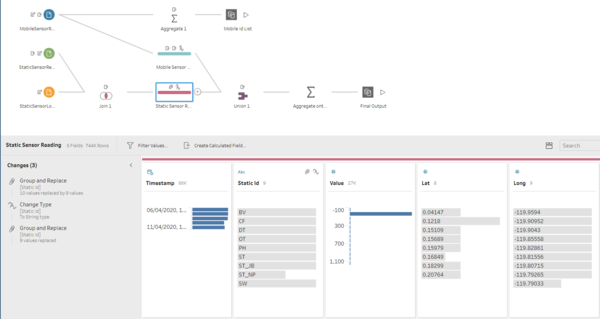
| 4. Rename Static ID into unique string ID names | |
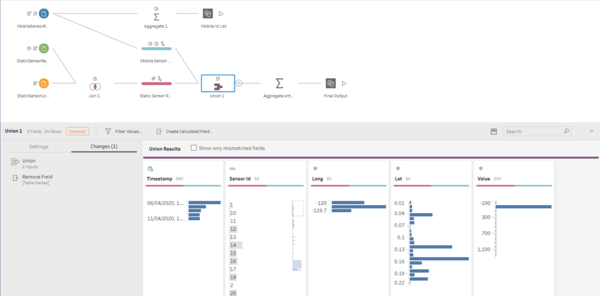
| 5. Union Static Sensor Reading and Mobile Sensor Reading based on Static ID and Mobile ID respectively | |
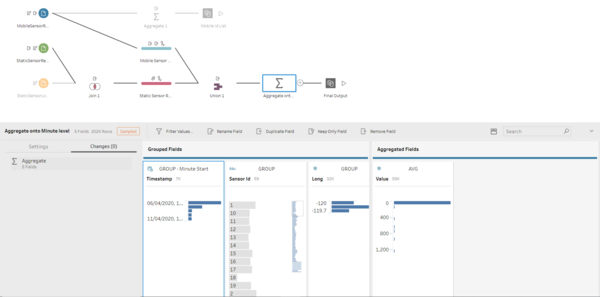
| 6. Group columns and aggregate readings of 5-second interval readings into minute level | |
| 7. Save output as .hyper file extension | |
| 8. Run Tableau Prep Flow to get 2 .hyper file as output | N.A |
Tableau Desktop
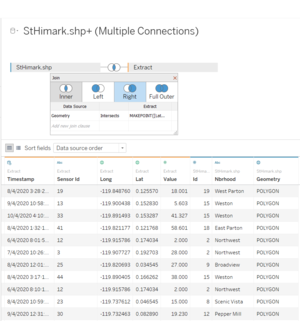
In order to make sure of the shape file of St Hilmark, we need to combine the readings obtained from Tableau Prep with the geometry shape file. This is possible only with the MakePoint function that allows intersection of geometry files as shown below where we inner join both data sets.
Issues to Highlight
Getting the average radiation reading value based on minute level
Issue: It is documented in the data description, that the radiation readings are obtained from all sensors in a 5-second interval. This meant that in a minute, there are at least 12 recorded rows of data per sensor. The total number of rows would severely inflate the size of the data file more than necessary which creates a situation where there is a lot of redundant data.
Solution: Obtain the average radiation reading per minute for each sensor for all timestamps value. This should reduce the size of the data file by at least 12 times and enhance the performance of tableau while maintaining accuracy of the radiation reading that is relevant for the sensor's coordinates.
Mobile Sensor ID and User ID Name
Issue: In Mobile Sensor Reading file, the User ID column has a lot of repeated values that can be easily distinguished by using Sensor ID. This makes the column of data slightly redundant.
Solution: By borrowing concepts from database normalization, we can create a key-value pair that corresponds Sensor ID with User ID. By creating a separate list, we can reduce the amount of data in the excel file. This file is then extracted as a Mobile ID List for future reference if necessary.
Renaming of St Hilmark Static Sensor
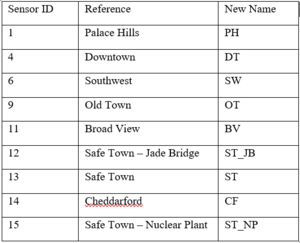
Issue: By identifying the unique values for the sensors, we realize that there are common integer values that are used to uniquely identify both static and mobile sensors. The Sensor ID for Static sensors ranges from 1 to 15. This would complicate the work process to identify the sensors if both static and mobile sensors use the same values.
Solution: The Sensor ID used for the static sensor is renamed as a string value to reflect the neighborhood that each sensor is located in. This would make it easy to interpret where this static sensor is located in. To reflect the changes on the mobile sensors, the integer values are changed to string type accordingly.

