Difference between revisions of "IS428 AY2019-20T1 Assign Lim Pei Xuan: Visualization"
Jump to navigation
Jump to search

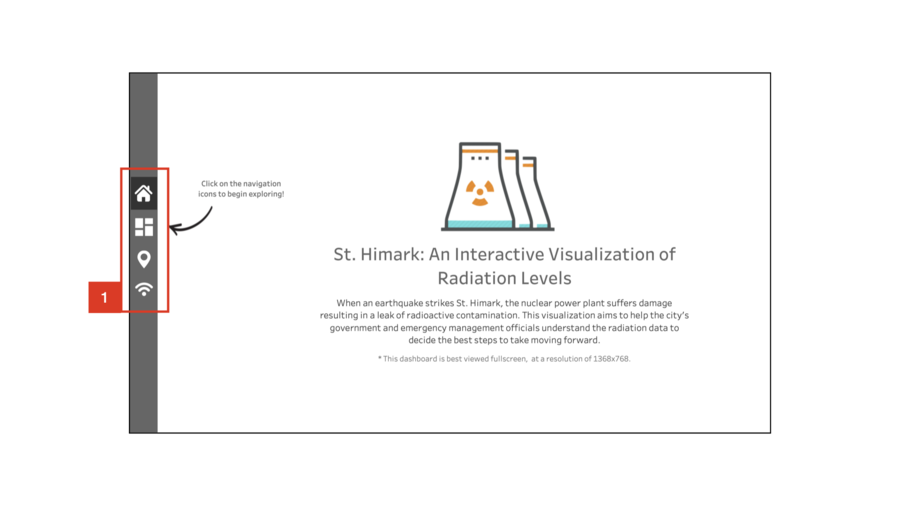
Home Page
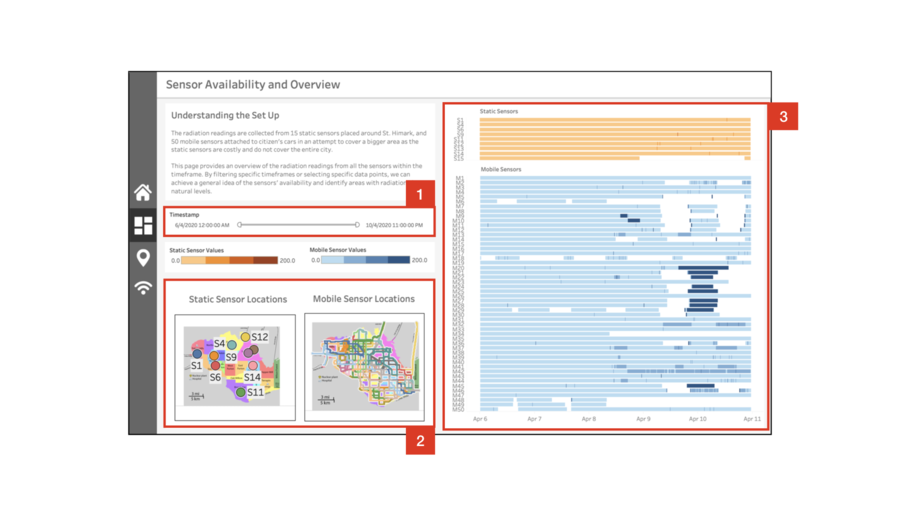
Overview Page
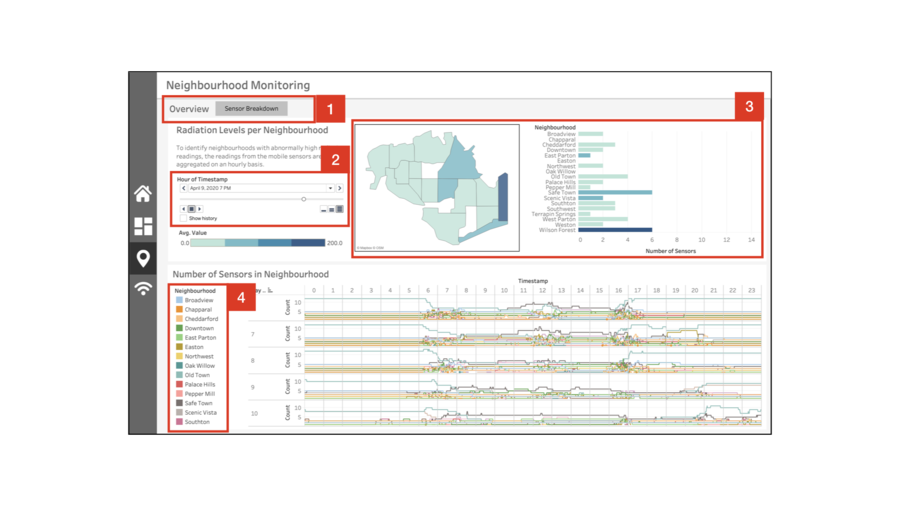
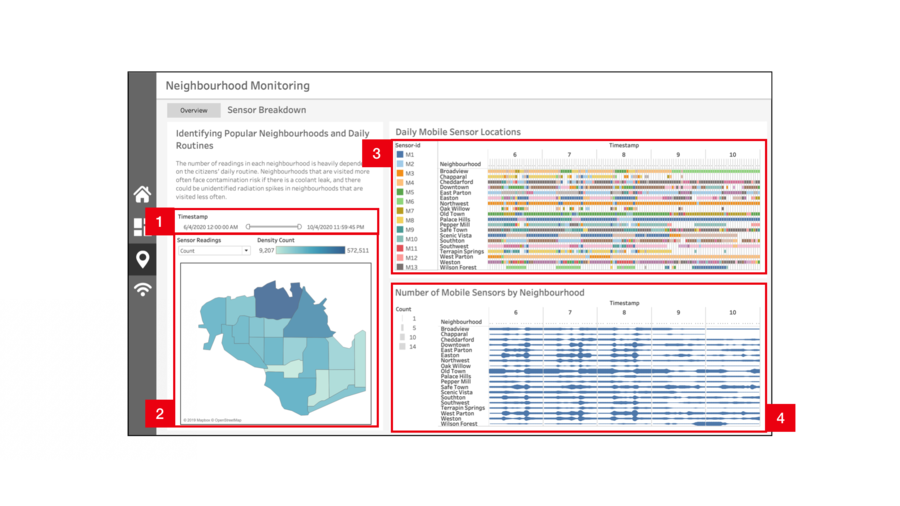
Neighbourhood Monitoring Page
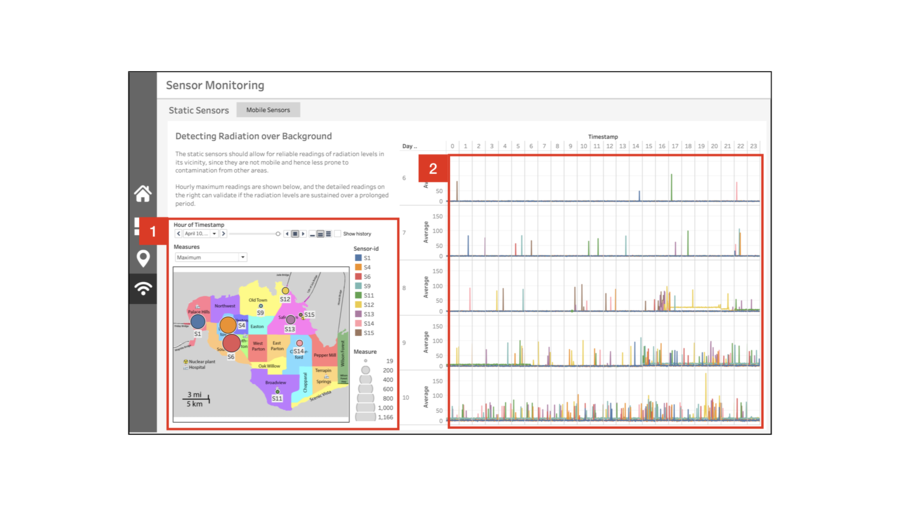
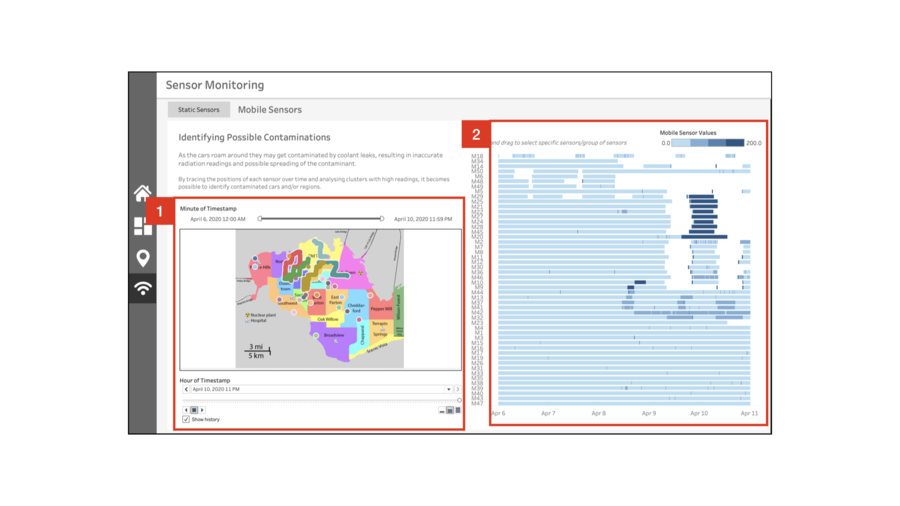
Sensor Monitoring Page
| Line 25: | Line 25: | ||
[[File:LPXASGVIZ1.jpg|900px|center]] | [[File:LPXASGVIZ1.jpg|900px|center]] | ||
== Walkthrough == | == Walkthrough == | ||
| + | The final interactive visualization consists of a few linked Dashboards: | ||
| + | # Home | ||
| + | # Sensor Availability and Overview | ||
| + | # Neighbourhood Monitoring | ||
| + | #* Overview | ||
| + | #* Sensor Breakdown | ||
| + | # Sensor Monitoring | ||
| + | #* Static Sensors | ||
| + | #* Mobile Sensors | ||
| + | <br> | ||
<p> | <p> | ||
| Line 154: | Line 164: | ||
|} | |} | ||
<br> | <br> | ||
| + | |||
== Techniques == | == Techniques == | ||
Revision as of 18:22, 12 October 2019


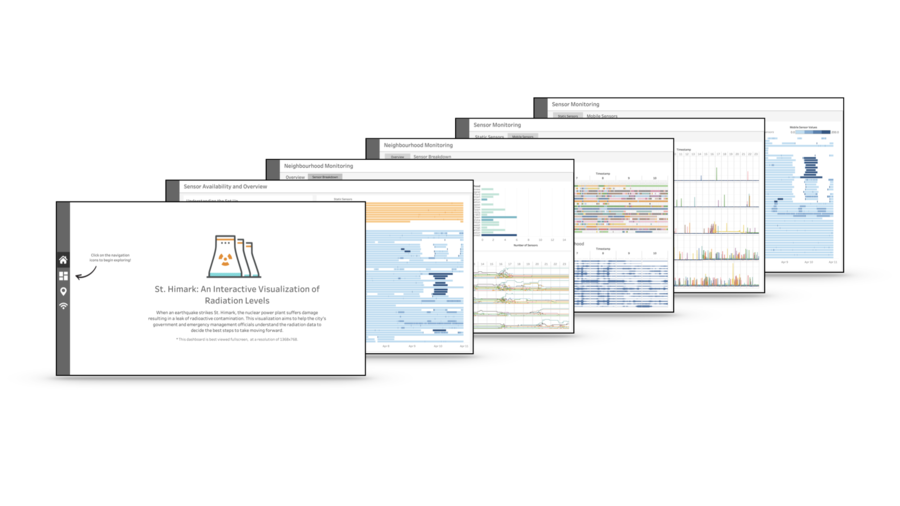
Walkthrough
The final interactive visualization consists of a few linked Dashboards:
- Home
- Sensor Availability and Overview
- Neighbourhood Monitoring
- Overview
- Sensor Breakdown
- Sensor Monitoring
- Static Sensors
- Mobile Sensors

| No. | Description |
|---|---|
|
1 |
Blablabla |

| No. | Description |
|---|---|
|
1 |
Blablabla |
|
2 |
Blablabla |
|
3 |
Blablabla |

| No. | Description |
|---|---|
|
1 |
Blablabla |
|
2 |
Blablabla |
|
3 |
Blablabla |
|
4 |
Blablabla |

| No. | Description |
|---|---|
|
1 |
Blablabla |
|
2 |
Blablabla |
|
3 |
Blablabla |

| No. | Description |
|---|---|
|
1 |
Blablabla |
|
2 |
Blablabla |

| No. | Description |
|---|---|
|
1 |
Blablabla |
|
2 |
Blablabla |