Difference between revisions of "IS428 AY2019-20T1 Assign Teng Jing Wen"
Jwteng.2017 (talk | contribs) |
Jwteng.2017 (talk | contribs) |
||
| Line 221: | Line 221: | ||
|- | |- | ||
|[[File:Db3-1.png|500px|center]] | |[[File:Db3-1.png|500px|center]] | ||
| − | || | + | || |
| − | * | + | * The dashboard begins with a guide that tells the analyst to select the filters based on the points of interest. |
| − | * | + | * Most of the filters are multi-select dropdown lists except for time which is filtered with a slider. This allows the analyst to provide a range for the time. |
| + | * The chart on the damage reports made by the neighbourhoods is placed beside the chart on shake intensity reports as this allows for quick reference/comparison between both reports. A comparison between both charts will show any association between the shake intensity experienced and damage observed. For instance, if a particular neighbourhood reported high damage done at a particular time, yet the shake intensity was reported low, the discrepancy shows that the damage done was likely due to other factors instead of the earthquake. Hence, further analysis will have to be done to determine if the reports were based on the earthquake impacts. | ||
|- | |- | ||
Revision as of 02:10, 12 October 2019
Contents
- 1 Problem and Motivation
- 2 Transforming and analysing the dataset
- 3 Dataset Import Structure & Process
- 4 Interactive Visualisation and Design Implementation
- 4.1 Home Dashboard: Interactive Visualisation
- 4.2 Home Dashboard: Design Implementation
- 4.3 Live Emergency Reports Dashboard: Interactive Visualisation
- 4.4 Live Emergency Reports Dashboard: Design Implementation
- 4.5 Emergency Report Analysis Dashboard: Interactive Visualisation
- 4.6 Emergency Report Analysis Dashboard: Design Implementation
- 5 Insights from dashboards
- 6 Other Interesting Observations
- 7 References
- 8 Comments
Problem and Motivation
St. Himark has been hit by an earthquake, leaving officials scrambling to determine the extent of the damage and dispatch limited resources to the areas in most need. They quickly receive seismic readings and use those for an initial deployment but realize they need more information to make sure they have a realistic understanding of the true conditions throughout the city.
In a prescient move of community engagement, the city had released a new damage reporting mobile application shortly before the earthquake. This app allows citizens to provide more timely information to the city to help them understand damage and prioritize their response. In this mini-challenge, use app responses in conjunction with shake maps of the earthquake strength to identify areas of concern and advise emergency planners. Note: the shake maps are from April 6 and April 8 respectively.
With emergency services stretched thin, officials are relying on citizens to provide them with much needed information about the effects of the quake to help focus recovery efforts.
By combining seismic readings of the quake, responses from the app, and background knowledge of the city, help the city triage their efforts for rescue and recovery.
Transforming and analysing the dataset
<Before the analysis began, the dataset given is analysed to identify its respective format and attributes. There were 6 different zip files provided in the assignment and each has its own unique ways to process and make sense of the data to bring value to the analysis. This section will elaborate on the dataset analysis and transformation process for each dataset in order to prepare the data for import and analysis on an interactive visualization.>
Data Cleaning
| Problem 1 | Transposing the Data |
|---|---|
| Issue | The damage reports given contain multiple columns of damage area reported and this will make it difficult for interpretation on Tableau, especially when attempting to plot charts. |
| Solution |  |
| Problem 2 | Polygon issue?? |
|---|---|
| Issue | |
| Solution |
Issue: .
Solution:
Issue:
Solution:
Dataset Import Structure & Process
After performing the data transformation, the data from 3 data sources will be imported into Tableau.

As there are 3 different datasets to import, we will need to perform inner joins on the tables together with a common attribute. The relationship between each data source is as follow:
- Between reports data and StHimark Features
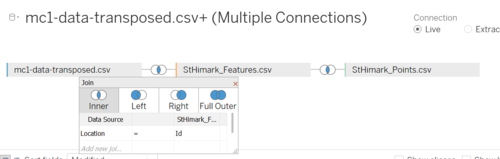
- Between StHimark Features and StHimark Points
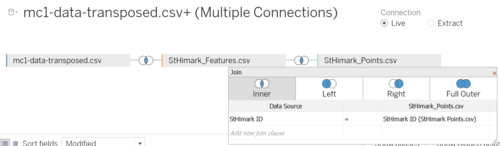


After joining the data by common attribute, additional processing to the data sources still has to be done.
Additional Processing: Emergency Reports Data
| No. | Brief Implementation |
|---|---|
| 1. |
Under the data source tab, we will rename the "Time" field into Date and create an additional Time field. The following formula will be used: “MAKETIME(DATEPART('hour',[Date]), DATEPART('minute',[Date]),0)”  |
| 2. |
 |
| 3. | Under a new Worksheet, perform the following actions:
|
| 4. | Example |
Additional Processing: St.Himark Points and St.Himark Features
| No. | Brief Implementation |
|---|---|
| 1. | Example |
| 2. | Example |
Interactive Visualisation and Design Implementation
Home Dashboard: Interactive Visualisation
| Interactive Technique | Rationale | Brief Implementation Steps |
|---|---|---|
 |
Allows user to navigate to other dashboards based on selected options. |
|
Home Dashboard: Design Implementation
| Design | Rationale & Brief Implementation |
|---|---|
 |
The home page dashboard gives the analyst an overview of what insights the dashboards will provide and directs the user to either dashboard based on their objectives. It also serves as a navigation tool, for the user to switch between Live Emergency Reports, and an overall Emergency Report Analysis. |
Live Emergency Reports Dashboard: Interactive Visualisation
| Interactive Technique | Rationale | Brief Implementation Steps |
|---|---|---|
|
Drop date and time to filters and select relative range to obtain the slider feature. | |
|
Configure filter format to multi-select dropdown list. | |
|
|
Live Emergency Reports Dashboard: Design Implementation
| Design | Rationale & Brief Implementation |
|---|---|
 |
|
 |
|
Emergency Report Analysis Dashboard: Interactive Visualisation
| Interactive Technique | Rationale | Brief Implementation Steps |
|---|---|---|
 |
|
Configure filter to multi-select dropdown list. |
 |
|
Configure filter to multi-select list. |
|
Drop date and time to filters and select relative range to obtain the slider feature. | |
 |
|
Configure filter to multi-select list. |
 |
|
Configure filter to multi-select list. |
Emergency Report Analysis Dashboard: Design Implementation
| Design | Rationale & Brief Implementation |
|---|---|
 |
|
 |
ex
|
Insights from dashboards
Q1
Emergency responders will base their initial response on the earthquake shake map. Use visual analytics to determine how their response should change based on damage reports from citizens on the ground. How would you prioritize neighborhoods for response? Which parts of the city are hardest hit? Limit your response to 1000 words and 10 images.
| No. | Observations |
|---|---|
| 1 | Based on the geographical map with various colour intensities, we can tell that the average shake intensity reported by citizens on 8/4/2020, is the highest in Neighbourhood 3. This insight is highly reliable based on the earthquake shake map provided as the earthquake comes from the north-east direction. Hence it is like that Neighbourhoods 3, 4, 12 and 7 have the largest hit.
 |
| 2 | Heatmap shows the increase in number of reports from 8am to 12pm. It is hence possible to deduce that the actual earthquake started around 8am until approximately 11am. We will hence filter our reportings based on the following timeframe (Date = 8/4/2020, Time= 8:00:00AM to 11:00:00AM).  |
| 3 | It will be insufficient to work out an emergency response plan based on the findings of the shake intensity reports alone. Assuming that the emergency response team has separate departments for each facility within St.Himark, we will analyse the damage reports categorized by facilities (e.g. Sewer and Water, Medical facilities etc).
 Insights show that the towns along Neighbourhoods 7 to 9 have reported relatively higher damage done on facilities such as roads and bridges, sewer and water, and buildings. According to these data, it is likely that emergency responders have to be deployed to these neighbourhoods within a timely period as well, considering the high damage ratings reported. |
| 4 |
Conclusions:
- Based on our findings from the damage and shake intensity reports, generally, Neighbourhood 3 appears to have experienced the largest hit from the earthquake on 8th April, between 08:00 AM to 11:00 AM.
- Concerning the prioritising of the emergency response - the emergency responders under the medical facilities department should note that there are neighbourhoods with medical facilities that provide trauma and critical care services. This could imply that sufficient attention should also be brought to assess the criticality of the situation on these areas. Likewise, for the power department, there is a nuclear power plant at Neighbourhood 4 which is responsible for supplying 72% of St.Himark’s power. It will be critical to assess the condition and deploy aid to that area in order to help regain power for the majority of the residents.
Q2
Use visual analytics to show uncertainty in the data. Compare the reliability of neighborhood reports. Which neighborhoods are providing reliable reports? Provide a rationale for your response. Limit your response to 1000 words and 10 images.
| No. | Observations |
|---|---|
| 1 | We can interpret that reports on the current shake intensity is still constantly sent even a day after the earthquake, on the 8th. This implies that there is a level of inaccuracy in the reports made. Analysing the heatmap that has been filtered to show reports made post-earthquake, it is seen that Neighbourhood 3 has the greatest number of reports (indicating high shake intensity) made followed by Neighbourhoods 4 and 12.   |
| 2 | Next, the shake intensity reports also showed that Neighbourhood 10 had generally rated higher intensity on 9th April than 8th April.
 |
| 3 | It can be inferred that more reports on damage and shake intensity were made on the earlier morning of 9th April, while 8th April had minimal reports made. Additionally, the damage done rated on power was seemingly high at a rank point of 9. This could signal a power failure that resulted in the delay of reports made during the actual earthquake.  |
| 4 | To further confirm our hypothesis, the filter of event date is set to display the charts on the day of the actual earthquake. Based on chart below, it can hence be deduced that there could indeed be a power outage during the earthquake at Neighbourhood 10.  |
| 5 | The heatmap below shows the damage reports made before the day of the earthquake, and generally, Neighbourhoods 3 and 9 have also reported on damages observed. Since these damages happen before the accident, it likely arose from ongoing maintenance works by the facilities.  |
Conclusions:
- Neighbourhoods 3 and 9 reported damage observed that could be from maintenance works instead of the earthquake. This shows that the emergency reports were made not pertaining to the earthquake, which could have diverted the emergency response efforts to aid the neighbourhoods that require urgent assistance.
- The uncertainty of reports, which also refers to the inaccuracy of reports could also be due to power issues that caused a delay in the time the reports were sent to the responders.
Q3
How do conditions change over time? How does uncertainty in change over time? Describe the key changes you see. Limit your response to 500 words and 8 images.
| No. | Observations |
|---|---|
| 1 | To analyse the conditions and uncertainty changes overtime, we will need to draw insights from both dashboards.
Based on the shake intensity map, we can note that the reports on shake intensity were generally low until 8th April 8:00AM where the intensity was reported higher. These reports lasted until the early hours of 9th April (perhaps due to power/network delay in sending the reports). However, looking at the change in condition (based on reports made), there could likely be another minor earthquake on 9th April at around 3PM. The reports on shaking slowed down after 9PM on 9th April. While this is not reflected on the response shake map, with more than a couple of neighbourhoods making shake reports, this should likely not be a case of unreliable reporting.  |
| 2 | Next, running through the time series animation of the damage reports on each facility, at particular timeframes, there are certain neighbourhoods with no reports made on all facilities (i.e. null values in the reports). This could also be due to intermittent power outages around the towns (Neighbourhoods 3 and 5) due to ongoing project works. <insert image> |
| 3 | |
| 4 |
Conclusions:
- xxxxx
- xxxxx
Other Interesting Observations
| No. | Observations |
|---|---|
| 1 | |
| 2 |
| Department | Activities |
|---|---|
| |
| |
| |
| |
|
References
The following references have been useful in the completion of the analysis process:
- <title> (url)