Difference between revisions of "IS428 AY2019-20T1 Assign Chan Huang Suan Processing"
Jump to navigation
Jump to search
Hschan.2016 (talk | contribs) |
Hschan.2016 (talk | contribs) |
||
| Line 1: | Line 1: | ||
| + | <p> | ||
| + | To begin, we need to understand the datasets that we are dealing with. Upon opening the project files, we can see: | ||
| + | </p> | ||
| + | |||
{| class="wikitable" | {| class="wikitable" | ||
|- | |- | ||
| Line 15: | Line 19: | ||
|| <b>Mobile Sensor Readings</b> | || <b>Mobile Sensor Readings</b> | ||
|| [[File:Mobile_Sensor_Readings_ChanHuangSuan.PNG|400px|center]] | || [[File:Mobile_Sensor_Readings_ChanHuangSuan.PNG|400px|center]] | ||
| − | || Lists mobile sensor's radiation reading values at a 5 second interval, with coordinates | + | || Lists mobile sensor's radiation reading values at a 5 second interval, with coordinates. <p><b>Note: </b> There are more rows that exceeds the Excel limit when we open the file.</p> |
|- | |- | ||
|| <b>St Hilmark Map & Coordinates</b> | || <b>St Hilmark Map & Coordinates</b> | ||
| − | || [[File:Map_Image_ChanHuangSuan.png| | + | || [[File:Map_Image_ChanHuangSuan.png|200px|center]] |
| − | || An | + | || An image file showcasing St Hilmark's neighborhood and its landmarks |
|} | |} | ||
Revision as of 00:33, 12 October 2019
To begin, we need to understand the datasets that we are dealing with. Upon opening the project files, we can see:
| File name | Image | Purpose |
|---|---|---|
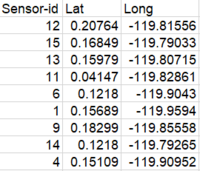
| Static Sensor Location | Lists static sensor's geographic coordinates | |
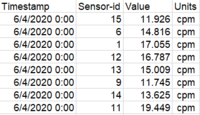
| Static Sensor Readings | Lists static sensor's radiation reading values at a 5 second interval | |
| Mobile Sensor Readings | Lists mobile sensor's radiation reading values at a 5 second interval, with coordinates. Note: There are more rows that exceeds the Excel limit when we open the file. | |
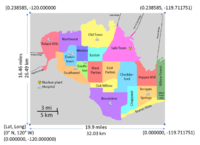
| St Hilmark Map & Coordinates | An image file showcasing St Hilmark's neighborhood and its landmarks |


