Difference between revisions of "IS428-AY2019-20T1 Group01-Proposal"
Jump to navigation
Jump to search
| Line 35: | Line 35: | ||
! Reference of Other Interactive Visualization !! What we Learnt | ! Reference of Other Interactive Visualization !! What we Learnt | ||
|- | |- | ||
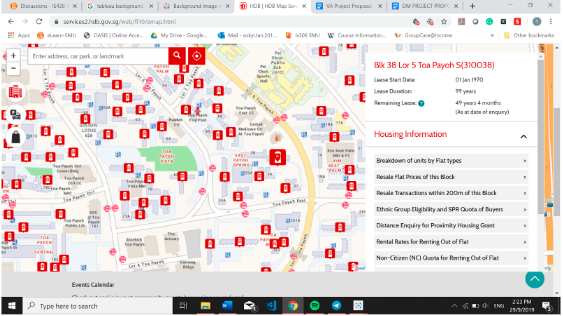
| − | | | + | | '''Title: HDB One Map''' |
| + | [[File:Onemap.png|300px|frame|center]] | ||
| + | Source: https://services2.hdb.gov.sg/web/fi10/emap.html | ||
| + | || | ||
| + | * Shows detailed information on HDB flats but lacks the tool to show an overview on the hdb estates in singapore | ||
| + | * It is usability is limited by its lack of function to filter by different data variables e.g. region, street, Model, Floor Range, Floor Area and etc. | ||
| + | |||
|- | |- | ||
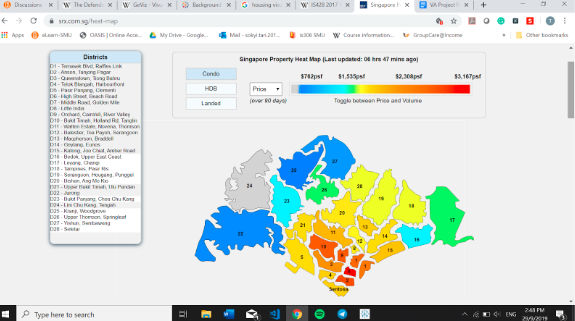
| − | | | + | | '''Title: SRX Heat Map''' |
| + | [[File:SRX Heatmap.png|300px|frame|center]] | ||
| + | || | ||
| + | * Shows an overview of the price and transaction volume of the different types of estate in different towns. | ||
| + | * Bad color scheme used | ||
| + | * Could include more interactive elements to the chart & detailed information (eg when hover over a district can show price & no. of transactions) | ||
| + | Source: https://www.srx.com.sg/heat-map | ||
|- | |- | ||
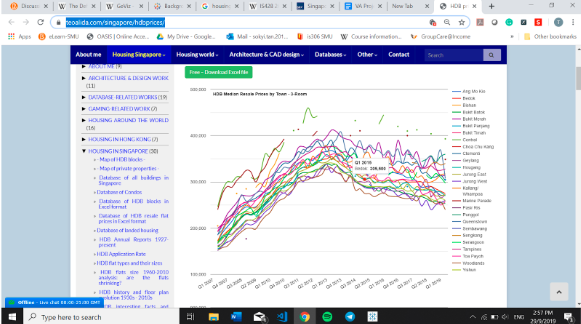
| − | | | + | | '''Title: Line Chart''' |
| + | [[File:Linegraph.png|300px|frame|center]] | ||
| + | || Example | ||
|- | |- | ||
| Example || Example | | Example || Example | ||
Revision as of 18:25, 10 October 2019
Contents
Problem Statement
Problem: Our team has identified a lack of information on the HDB for homebuyers who wants to understand and make analysis on which HDB to buy.
Motivation: With the increasing demand for housing, there is a need for homeowners to have a better understanding over the flats they are purchasing. Hence, there is a need to analyze the resale prices of the flats and the facilities available.
Objectives
Selected Data Sets
| Dataset/Source | Data Attributes | Rationale of Usage |
|---|---|---|
| HDB Resale Flat Prices |
|
To gain information on the HDB procurement over the years such as the Resales prices by flat type, Area size and Floor level and the lease date of the flat. |
Background Survey of Related Work
| Reference of Other Interactive Visualization | What we Learnt |
|---|---|
| Title: HDB One Map |
|
| Title: SRX Heat Map |
Source: https://www.srx.com.sg/heat-map |
| Title: Line Chart | Example |
| Example | Example |
| Example | Example |
Proposed Dashboard
| Dashboards | Rational |
|---|---|
| Example | Example |
| Example | Example |
| Example | Example |


