Difference between revisions of "IS428-AY2019-20T1 Climate Vizards: Proposal - Brainstorming & Storyboard"
Jump to navigation
Jump to search
(Created page with "<div style=background:#FFCF99 border:#000000> 200px <font size = 8; color="#000000"> Climate Vizards</font> </div> <!--MAIN HEADER --> {|style="background...") |
|||
| Line 58: | Line 58: | ||
| | | | ||
|} | |} | ||
| − | < | + | |
| + | =Brainstorming= | ||
| + | |||
| + | [[File:Brainstorming.jpg|700px|frameless|border|center]] | ||
| + | |||
| + | We came out with a list of visualization which is able to achieve our objectives and added on to a list of existing visualization done by Meteorological Service Singapore (MSS). We have shortlisted a few of the visualization as listed: | ||
| + | * Calendar Heat Map | ||
| + | * Geographic Visualization | ||
| + | * Line Graph | ||
| + | * Area chart | ||
| + | * Histogram | ||
| + | |||
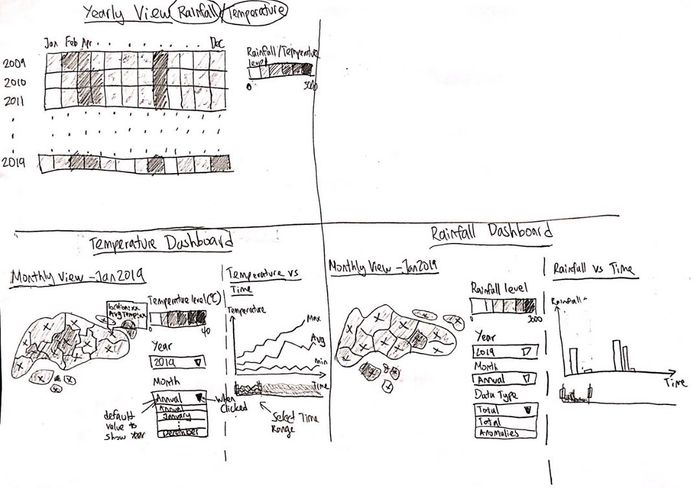
| + | =Storyboard= | ||
| + | Our group has proposed the following storyboard in our Data Visualisation Application: | ||
| + | |||
| + | {| border="1" cellpadding="1" | ||
| + | |- style="background-color:#FFCF99; color:black; height:50px" | ||
| + | ! style="width:300px"| Proposed Layout | ||
| + | ! style="width:300px"| Analysis | ||
| + | |- | ||
| + | |||
| + | || | ||
| + | <center> | ||
| + | [[File:Calendar Heat Map.jpg|300px|border]] | ||
| + | </center> | ||
| + | || | ||
| + | <font size="3.5">'''Calendar Heat Map'''</font> | ||
| + | * Analyze the change in variable for a time-series study across the different Years,Months and Days | ||
| + | |- | ||
| + | |||
| + | || | ||
| + | <center> | ||
| + | [[File:Spatial Interpolation.jpg|300px|border]] | ||
| + | </center> | ||
| + | || | ||
| + | <font size="3.5">'''Spatial Interpolation'''</font> | ||
| + | * Analyze area of effect the variable has on the geographic visualisation considering the variance and predicted values | ||
| + | * View monthly level data for further insights on the variable | ||
| + | |- | ||
| + | |||
| + | || | ||
| + | <center> | ||
| + | [[File:Area Chart.jpg|300px|border]] | ||
| + | </center> | ||
| + | || | ||
| + | <font size="3.5">'''Area Chart'''</font> | ||
| + | * Allows users to have a quick look at the changes in temperature over time in a month or year as a whole | ||
| + | * Acts as a filtering bar for users to select the interested range to study the line graph | ||
| + | * Study trend in the changes in temperature over a period of time within the month | ||
| + | * Compare multiple metrics of the variable for deeper analysis | ||
| + | |- | ||
| + | |||
| + | || | ||
| + | <center> | ||
| + | [[File:Yearly Distribution.jpg|300px|border]] | ||
| + | </center> | ||
| + | || | ||
| + | <font size="3.5">'''Yearly Distribution'''</font> | ||
| + | * Study how the values in the data are spread out cross the different months in the chosen year | ||
| + | |- | ||
Revision as of 11:43, 13 October 2019
 Climate Vizards
|
|
|
|
|
|
|
|
|
|
|
|
|
Brainstorming

We came out with a list of visualization which is able to achieve our objectives and added on to a list of existing visualization done by Meteorological Service Singapore (MSS). We have shortlisted a few of the visualization as listed:
- Calendar Heat Map
- Geographic Visualization
- Line Graph
- Area chart
- Histogram
Storyboard
Our group has proposed the following storyboard in our Data Visualisation Application:
| Proposed Layout | Analysis |
|---|---|
|
|
Calendar Heat Map
|
|
|
Spatial Interpolation
|
|
|
Area Chart
|
|
|
Yearly Distribution
|


