Difference between revisions of "IS428 AY2019-20T1 Assign Ronald Lay Data Transformation"
| (5 intermediate revisions by the same user not shown) | |||
| Line 24: | Line 24: | ||
|} | |} | ||
| + | ==Data used for Mini Challenge 1== | ||
| + | *mc1-reports-data.csv | ||
| + | *StHimark.shp | ||
==Pivoting for categories== | ==Pivoting for categories== | ||
===Issue=== | ===Issue=== | ||
| − | The categories are represented in columns, which is difficult when performing the | + | The categories are represented in columns, which is difficult when performing the filters and charts in tableau. |
===Solution=== | ===Solution=== | ||
| − | + | Using Tableau prep to perform the pivoting of categories - Medical, Power, Road And Bridges, Sewer & Water and shake intensity - into a column called "Category" and "Reported intensity" for the value. | |
[[File:Pivoting.png|500px|thumb|center]] | [[File:Pivoting.png|500px|thumb|center]] | ||
| − | + | ==Binning of different intensity level== | |
| − | The raw data contains categorical data represented by number. However, number representation provides an unclear definition of how each value is perceived by the users. To standardize the definition, | + | ===Issue=== |
| − | + | The raw data contains categorical data represented by number. However, number representation provides an unclear definition of how each value is perceived by the users. | |
| − | [[File: | + | ===Solution=== |
| − | + | To standardize the definition, visual binning is performed by aligning the intensity value with instrumental intensity into a number of distinct categories. | |
| + | [[File:Ronald.Lay.2017_Instrumental_Intensity.PNG|500px|thumb|center]] | ||
| + | Follow the 2-step process | ||
| + | <center><strong>2 steps process</strong></center> | ||
| + | <div><center><ul> | ||
| + | <li style="display: inline-block;" id="F23"> [[File:Ronald.Lay.2017_Create_Calcul.PNG|thumb|center|450px]] </li> | ||
| + | <li style="display: inline-block;" id="F24"> [[File:Ronald.Lay.2017_Shake_Category.PNG|thumb|center|450px]] </li> | ||
| + | </ul></center></div> | ||
| + | </ul> | ||
| + | The output is generated below | ||
| + | <center>mc1-clean-data</center> | ||
| + | [[File:Ronald.Lay.2017_Output.PNG|thumb|center|450px]] | ||
| − | |||
| − | + | ==Importing data== | |
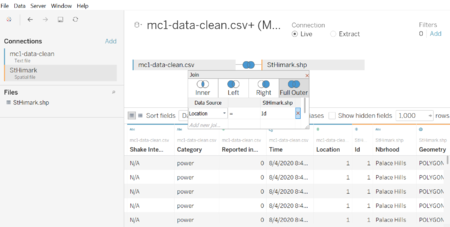
| + | This is the overall picture of importing data process. Mc1-data-clean is merged with stHimark.shp using location and id as common attribute. | ||
| + | [[File:Ronald.Lay.2017_Overall_Process.PNG|thumb|center|450px]] | ||
| − | [[File: | + | A map is successfully loaded into tableau |
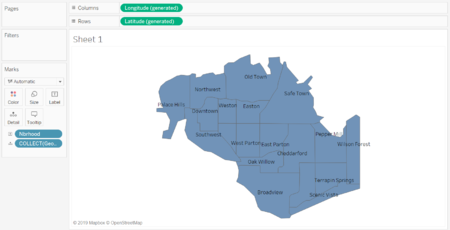
| + | [[File:Ronald.Lay.2017_Map.PNG|thumb|center|450px]] | ||
Latest revision as of 22:59, 13 October 2019
Contents
Data used for Mini Challenge 1
- mc1-reports-data.csv
- StHimark.shp
Pivoting for categories
Issue
The categories are represented in columns, which is difficult when performing the filters and charts in tableau.
Solution
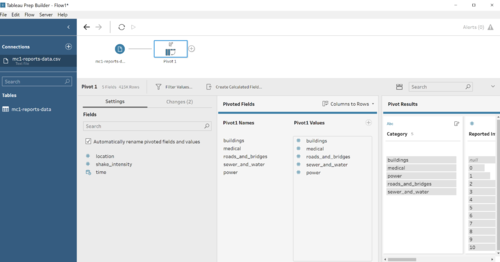
Using Tableau prep to perform the pivoting of categories - Medical, Power, Road And Bridges, Sewer & Water and shake intensity - into a column called "Category" and "Reported intensity" for the value.
Binning of different intensity level
Issue
The raw data contains categorical data represented by number. However, number representation provides an unclear definition of how each value is perceived by the users.
Solution
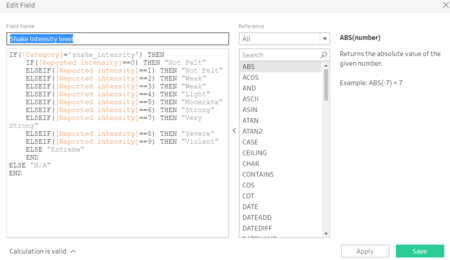
To standardize the definition, visual binning is performed by aligning the intensity value with instrumental intensity into a number of distinct categories.
Follow the 2-step process
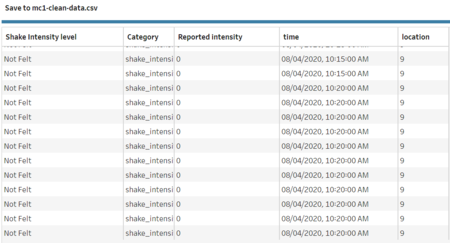
The output is generated below
Importing data
This is the overall picture of importing data process. Mc1-data-clean is merged with stHimark.shp using location and id as common attribute.
A map is successfully loaded into tableau
