Difference between revisions of "IS428-AY2019-20T1 Climate Vizards: Proposal - Brainstorming & Storyboard"
Jump to navigation
Jump to search

| Line 13: | Line 13: | ||
| style="font-family:Century Gothic; font-size:100%; solid #FFFFFF; background:#3e4859; text-align:center;" width="20%" | | | style="font-family:Century Gothic; font-size:100%; solid #FFFFFF; background:#3e4859; text-align:center;" width="20%" | | ||
; | ; | ||
| − | [[IS428-AY2019-20T1_Climate_Vizards: | + | [[IS428-AY2019-20T1_Climate_Vizards:_Proposal_-_Brainstorming_&_Storyboard| <font color="#FFFFFF">Proposal</font>]] |
| style="font-family:Century Gothic; font-size:100%; solid #FFFFFF; background:#535963; text-align:center;" width="20%" | | | style="font-family:Century Gothic; font-size:100%; solid #FFFFFF; background:#535963; text-align:center;" width="20%" | | ||
Latest revision as of 20:43, 13 October 2019

Climate Vizards
|
|
|
|
|
|
|
|
|
|
|
|
|
Brainstorming

We came out with a list of visualization which is able to achieve our objectives and added on to a list of existing visualization done by Meteorological Service Singapore (MSS). We have shortlisted a few of the visualization as listed:
- Calendar Heat Map
- Geographic Visualization
- Line Graph
- Area chart
- Histogram
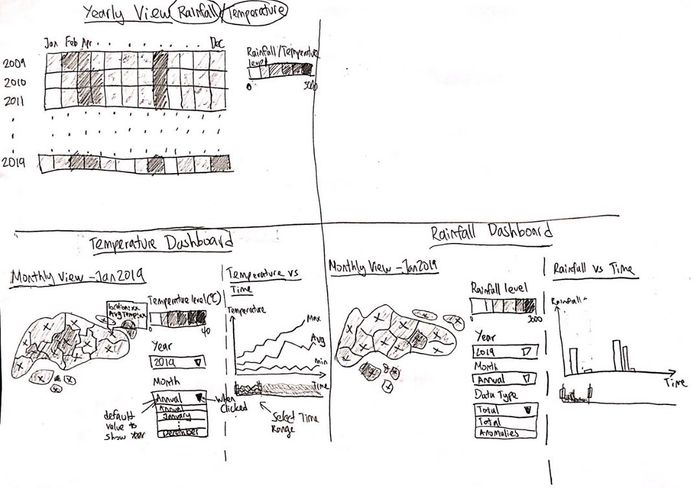
Storyboard
Our group has proposed the following storyboard in our Data Visualisation Application:
| Proposed Layout | Analysis |
|---|---|
|
|
Calendar Heat Map
|
|
|
Spatial Interpolation
|
|
|
Area Chart
|
|
|
Yearly Distribution
|


