Difference between revisions of "IS428 AY2019-20T1 Assign Kok Jim Meng"
Jump to navigation
Jump to search
| (2 intermediate revisions by the same user not shown) | |||
| Line 1: | Line 1: | ||
| − | <div style="background: #008080; | + | <div style=background:#76BA1B border:#8EE4AF #top> |
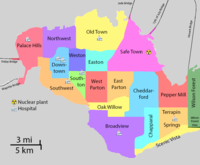
| + | [[File:StHimarkNeighborhoodMap.png|200px]] | ||
| + | '''<font size = 5; color="#FFFFFF" face="Times New Roman">IS428 VAST 2019 Mini Challenge 2 </font>''' | ||
| + | </div> | ||
| + | |||
| + | {|style="background-color:#008080 ;" width="100%" cellspacing="0" cellpadding="0" valign="top" border="0" | | ||
| + | | style="font-family:Helvetica Neue; font-size:100%; solid #000000; background:#008080; text-align:center;" width="20%" | | ||
| + | ; | ||
| + | [[IS428_AY2019-20T1_Assign_Kok_Jim_Meng_Problem & Motivation| <font color="#FFFFFF">Problem & Motivation</font>]] | ||
| + | |||
| + | | style="font-family:Helvetica Neue; font-size:100%; solid #1B338F; background:#008080; text-align:center;" width="20%" | | ||
| + | ; | ||
| + | [[IS428_AY2019-20T1_Assign_Kok_Jim_Meng_Data Preparation| <font color="#FFFFFF">Data Preparation</font>]] | ||
| + | |||
| + | | style="font-family:Helvetica Neue; font-size:100%; solid #1B338F; background:#008080; text-align:center;" width="20%" | | ||
| + | ; | ||
| + | [[IS428_AY2019-20T1_Assign_Kok_Jim_Meng_Interactive Visualisation| <font color="#FFFFFF">Interactive Visualisation</font>]] | ||
| + | |||
| + | | style="font-family:Helvetica Neue; font-size:100%; solid #1B338F; background:#008080; text-align:center;" width="20%" | | ||
| + | ; | ||
| + | [[IS428_AY2019-20T1_Assign_Kok_Jim_Meng_Tasks Questions and Answers| <font color="#FFFFFF">Tasks Questions and Answers</font>]] | ||
| + | |||
| + | | style="font-family:Helvetica Neue; font-size:100%; solid #1B338F; background:#008080; text-align:center;" width="20%" | | ||
| + | ; | ||
| + | [[IS428_AY2019-20T1_Assign_Kok_Jim_Meng_References and Comments| <font color="#FFFFFF">References and Comments</font>]] | ||
| + | |||
| + | | | ||
| + | |} | ||
| + | |||
| + | ==Problem & Motivation== | ||
Always Safe nuclear power plant has catered the needs of St. Himark citizens by producing and providing power. Moreover, it is also one of the largest employers in the city. However, the plant was not compliant with international standards when it was constructed and is now aging. | Always Safe nuclear power plant has catered the needs of St. Himark citizens by producing and providing power. Moreover, it is also one of the largest employers in the city. However, the plant was not compliant with international standards when it was constructed and is now aging. | ||
| Line 8: | Line 37: | ||
# Analyze uncertainty in the measurement of radiation across the city and whether the radiation measurements reliable enough to locate areas of concern | # Analyze uncertainty in the measurement of radiation across the city and whether the radiation measurements reliable enough to locate areas of concern | ||
# Summarise the state of radiation measurements at the end of the available period | # Summarise the state of radiation measurements at the end of the available period | ||
| − | |||
| − | |||
| − | |||
| − | |||
| − | |||
| − | |||
| − | |||
| − | |||
| − | |||
| − | |||
| − | |||
Latest revision as of 16:33, 12 October 2019
|
|
|
|
|
|
Problem & Motivation
Always Safe nuclear power plant has catered the needs of St. Himark citizens by producing and providing power. Moreover, it is also one of the largest employers in the city. However, the plant was not compliant with international standards when it was constructed and is now aging. When the earthquake strikes the city, there is a possibility of contamination from the damaged nuclear power plant. Hence, the goal of the project was to engage the community and demonstrate that the nuclear plant’s operations were not significantly changing the region’s natural background levels of radiation.
With the data collected, we can create an interactive visualisation using Tableau to meet the following objectives:
- Identify areas where radiation over background is detected based on radiation measurements over time from both static and mobile sensors.
- Analyze uncertainty in the measurement of radiation across the city and whether the radiation measurements reliable enough to locate areas of concern
- Summarise the state of radiation measurements at the end of the available period
