Difference between revisions of "IS428 AY2019-20T1 Assign Linus Cheng Xin Wei"
(→Tasks) |
|||
| Line 200: | Line 200: | ||
= Tasks = | = Tasks = | ||
| + | |||
| + | == Q1) Visualize radiation measurements over time from both static and mobile sensors to identify areas where radiation over background is detected. Characterize changes over time. == | ||
| + | |||
| + | {| class="wikitable" | ||
| + | |- | ||
| + | ! Step | ||
| + | ! Info | ||
| + | |- | ||
| + | | row 1 cell 1 | ||
| + | | row 1 cell 2 | ||
| + | |- | ||
| + | | row 2 cell 1 | ||
| + | | row 2 cell 2 | ||
| + | |} | ||
| + | |||
| + | == Q2) == | ||
| + | |||
| + | == Q3) == | ||
| + | |||
| + | == Q4) == | ||
| + | |||
| + | == Q5) == | ||
= Visualization = | = Visualization = | ||
Revision as of 14:31, 16 October 2019
Overview
One of St. Himark’s largest employers is the Always Safe nuclear power plant. The pride of the city, it produces power for St. Himark’s needs and exports the excess to the mainland providing a steady revenue stream. However, the plant was not compliant with international standards when it was constructed and is now aging. As part of its outreach to the broader community, Always Safe agreed to provide funding for a set of carefully calibrated professional radiation monitors at fixed locations throughout the city. Additionally, a group of citizen scientists led by the members of the Himark Science Society started an education initiative to build and deploy lower cost homemade sensors, which people can attach to their cars. The sensors upload data to the web by connecting through the user’s cell phone. The goal of the project was to engage the community and demonstrate that the nuclear plant’s operations were not significantly changing the region’s natural background levels of radiation.
When an earthquake strikes St. Himark, the nuclear power plant suffers damage resulting in a leak of radioactive contamination. Further, a coolant leak sprayed employees’ cars and contaminated them at varying levels. Now, the city’s government and emergency management officials are trying to understand if there is a risk to the public while also responding to other emerging crises related to the earthquake as well as satisfying the public’s concern over radiation.
Data
Data Files
| Name | Info |
|---|---|
| VAST 2019 - St. Himark - About Our City.docx | A document describing the scenario, as well as general information about St.Himark |
| MC2_datadescription.docx | A document that provides descriptions for data files provided for MC2 |
| MobileSensorReadings.csv | Contains readings from 50 mobile sensors that are attached to cars.
Data fields include: Timestamp, Sensor-id, Long, Lat, Value, Units, User-id. The timestamps are reported in 5 second intervals, though poor data connectivity can result in missing data. Each sensor has a unique identifier that is a number from 1 to 50. Location of the sensor is reported as longitude and latitude values (see map description below). The radiation measurement is provided in the Value field. Radiation is reported with units of counts per minute (cpm). Each measurement is independent and does not represent a summation over the previous minute. Some users have chosen to attach a user ID to their measurements while some others chose with a default name. |
| StaticSensorReadings.csv | Contains readings from a set of carefully calibrated professional radiation monitors at fixed locations throughout the city.
Data fields include: Timestamp, Sensor-id, Value, Units. |
| StaticSensorLocations.csv | Contains locations of the static sensors |
| StHimarkMapBlank.png | A picture containing the outline of the whole area of St Himark |
| StHimarkNeighborhoodMapNoLabels.png | A picture containing the outline of neighbourhoods in St Himark, without any labels |
| StHimarkNeighborhoodMap.png | A picture containing the outline of neighbourhoods in St Himark, including neighbourhood name, Nuclear plant and hospital labels |
| StHimarkLabeledMap.png | A fully labelled picture of St Himark, including main roads and bridges |
| StHimarkNeighborhoodShapefile | A folder containing a map of the neighbourhoods provided as a shapefile. Geometry of the polygons is reported in meters. |
Data Preprocessing and Cleaning
Creation of POI.csv
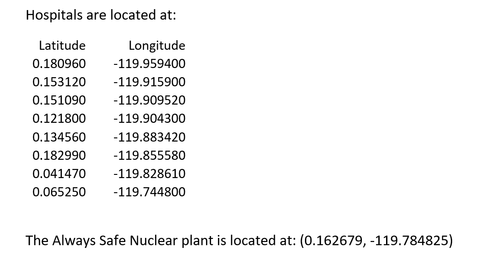
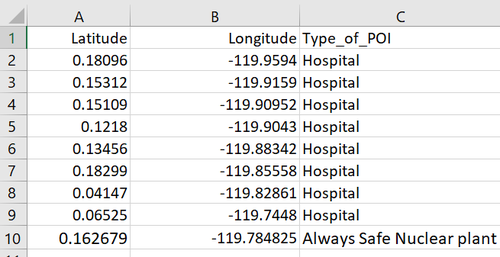
In 'MC2_datadescription.docx', a list of coordinates pertaining to the hospitals and Always Safe Nuclear plant located in St Hilmark was given. These are possible point of interests that might be useful for analysis, so I decided to create a data file to contain the information.
| Step | Info |
|---|---|
| 1. |
Open up MC2_datadescription.docx and scroll to the bottom to find coordinate information |
| 2. |
Input the information into excel to create a .csv file. The resulting file contains the following data columns:
|
Creation of StaticSensorConcat.csv, appending geographical coordinates to Static readers
As 'StaticSensorLocations.csv' and 'StaticSensorReadings.csv' share the common column, sensor-id, I am able to extract the geographical information from 'StaticSensorLocations.csv' and tie it to each individual reading.
| Step | Info |
|---|---|
| 1. |
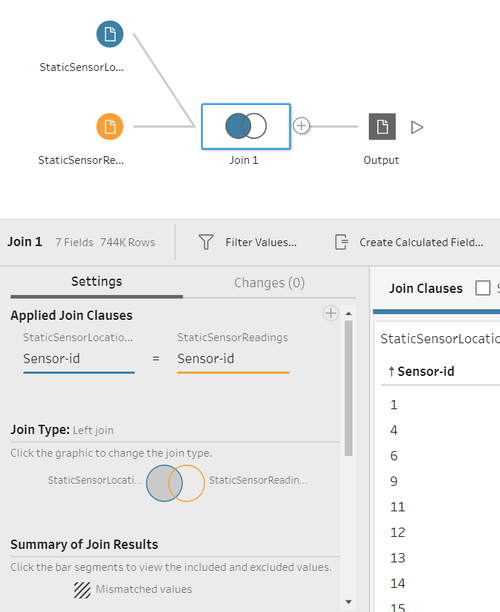
I opened up Tableau prep and loaded both 'StaticSensorLocations.csv' and 'StaticSensorReadings.csv'. I created a Join clause, with the common field being Sensor-id. I used a left join in this case because it sorts your data nicely at the output stage. |
| 2. |
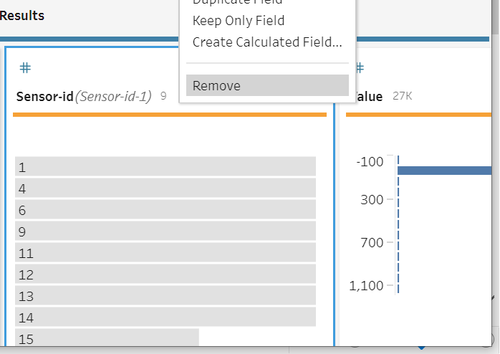
There is a redundant column called 'Sensor-id-1', which is a repeat of the 'Sensor-id' column. As it provides no utility, I decided to drop it in the Join function. |
| 3. |
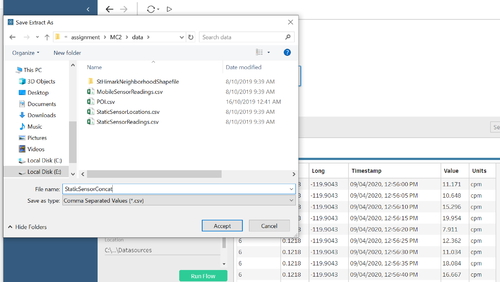
After inspecting the output and ensuring it is correct, I exported the file to a csv named 'StaticSensorConcat.csv'. |
| 4. |
The resulting file contains the following data columns:
Note, I left the units in place so that I could remember and understand what I'm dealing with. As well as providing some context if I ever view the project again. |
Creation of AllSensorData.csv
To make analysis easier, I want to combine both Static and Mobile sensors together into one file 'AllSensorData.csv'
| Step | Info |
|---|---|
| 1. |
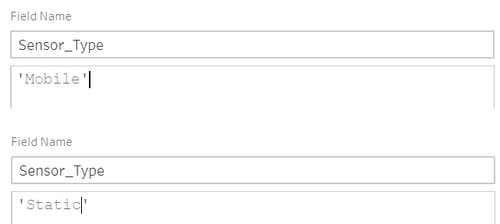
I created a new column named *Sensor_Type in order to differentiate between the static and mobile sensors. I did this by using creating a new calculated field, and filling in the value 'Static' or 'Mobile accordingly. |
| 2. |
Upon inspection of the 'User-id' column in 'MobileSensorReadings.csv', I realized that it does not provide any substantial amount of information to be used for analysis and decide to drop that column. As stated by a paragraph in 'MC2_datadescription.docx', the naming of the user's are not standardized, thus looking at the id number of each sensor would be better. |
| 3. |
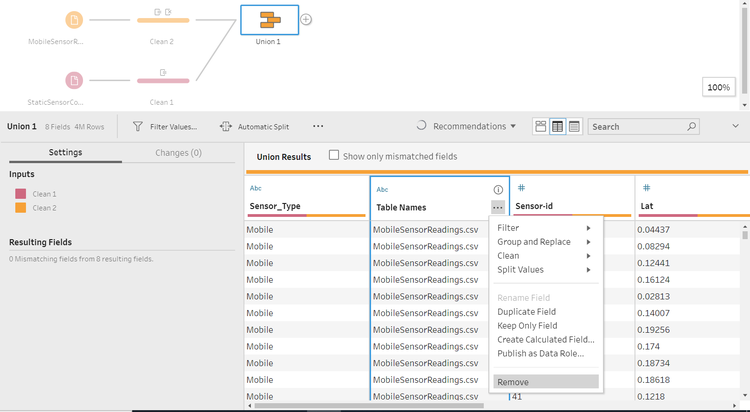
I used a union function in order to join the two datasets together. Since they have the exact same columns, there are 0 mismatching fields and I am able to perform the function with ease. I dropped the created column 'Table Names', as we have the column 'Sensor_Type' to differentiate between the 'Mobile' and 'Static sensors. |
| 4. |
The resulting file contains the following data columns:
|
Extracting Neighbourhood to data from StHimark.shp
Ever since Tableau 2019.2 came out, they have added the ability to manipulate spatial data. As there is a shapefile provided, I decided to combine some features into the main dataset, 'AllSensorData.csv'
| Step | Info |
|---|---|
| 1. |
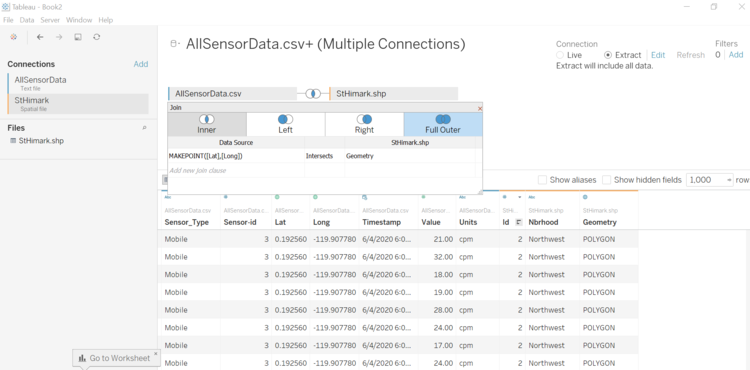
I changed the connection type to 'Extract', as it allows Tableau to function faster, and to use all the data available. |
| 2. |
Referencing https://www.tableau.com/about/blog/2016/4/tableau-online-tips-extracts-live-connections-cloud-data-53351, I used the Tableau function 'MAKEPOINT', which makes points so that we can join 'AllSensorData.csv' and 'StHimark.shp' based on their spatial relationship, Geometry. |
| 3. | The resulting file contains the following data columns:
|
Placeholder
Tasks
Q1) Visualize radiation measurements over time from both static and mobile sensors to identify areas where radiation over background is detected. Characterize changes over time.
| Step | Info |
|---|---|
| row 1 cell 1 | row 1 cell 2 |
| row 2 cell 1 | row 2 cell 2 |
Q2)
Q3)
Q4)
Q5)
Visualization
References
Tableau Online tips: Extracts, live connections, & cloud data - https://www.tableau.com/about/blog/2016/4/tableau-online-tips-extracts-live-connections-cloud-data-53351
Comments
Please comment I will note with thanks
