Difference between revisions of "IS428-AY2019-20T1 Group09-Proposal"
Cllee.2017 (talk | contribs) |
Cllee.2017 (talk | contribs) |
||
| Line 320: | Line 320: | ||
==<div style="background:#143c67; padding:15px; font-weight: bold; line-height: 0.3em;letter-spacing:0.5em;font-size:20px"><font color=#fbfcfd face="Century Gothic"><center>TECHNOLOGIES</center></font></div>== | ==<div style="background:#143c67; padding:15px; font-weight: bold; line-height: 0.3em;letter-spacing:0.5em;font-size:20px"><font color=#fbfcfd face="Century Gothic"><center>TECHNOLOGIES</center></font></div>== | ||
<br/> | <br/> | ||
| − | + | The tools we will be using for this Project is as follows: <br> | |
| − | The | + | <center>[[File:G9 technologies.png|frameless]]</center> |
| − | [[File: | ||
<br/> | <br/> | ||
==<div style="background:#143c67; padding:15px; font-weight: bold; line-height: 0.3em;letter-spacing:0.5em;font-size:20px"><font color=#fbfcfd face="Century Gothic"><center>CHALLENGES</center></font></div>== | ==<div style="background:#143c67; padding:15px; font-weight: bold; line-height: 0.3em;letter-spacing:0.5em;font-size:20px"><font color=#fbfcfd face="Century Gothic"><center>CHALLENGES</center></font></div>== | ||
| Line 334: | Line 333: | ||
|- | |- | ||
| | | | ||
| − | + | Lack of proficiency in using R and R Shiny | |
|| | || | ||
| − | * | + | * Complete DataCamp courses on the relevant technologies |
| − | * | + | * Watch tutorial videos |
| − | * | + | * Read the documentation |
|- | |- | ||
| | | | ||
| − | + | District Crime Rates are in separate files, with different data attributes. | |
|| | || | ||
| + | * Clean the data to ensure that the columns are similar | ||
| + | * Consolidate the data into one file for the years 2001-2015. | ||
| + | |- | ||
| + | | | ||
| + | Difficulty in understanding some of the data attributes due to its local context, such as the different acts for protection against women found in some of our datasets. | ||
| − | * | + | || |
| − | + | * Conduct more research on India and its history of crimes against women to get a better understanding of the data. | |
| − | + | |- | |
| + | | | ||
| + | Difficulty in finding socioeconomic factors by state level | ||
| − | | | + | || |
| − | | | + | * Look to different data sources to find more socioeconomic factors for consideration. |
| − | * | + | |- |
| − | || | + | | |
| + | The socioeconomic factors identified may not be indicative of the crime rate against women in India, as there may not be a relationship between the two. | ||
| − | * | + | || |
| − | + | * Do EDA to discover any correlation between each socioeconomic factor and the crime rate, then select the relevant ones from there | |
| − | |||
| − | |||
|} | |} | ||
</center> | </center> | ||
| − | |||
<br/> | <br/> | ||
Revision as of 13:14, 12 October 2019
<--- Go Back to Project Groups
Contents
PROBLEM STATEMENT
According to the Thomson Reuters Foundation Annual Poll, India is ranked as the world’s most dangerous country for women. This is not surprising, as India has had a long-standing history of violence against women, which is deeply rooted in certain cultural practices such as female infanticide and acid attacks.
Even with the increasing public outcry regarding such discrimination and the enactment of laws protecting women, the number of crimes committed against women is increasing steadily over the years.
MOTIVATION
India is one of the world’s fastest growing economies. It is currently the seventh richest country in the world, and is projected to be the third largest economy in the world. Despite its rapid growth and development, women in India still suffer from long-standing gender inequality and are the victims to brutal and inhumane crimes. Hence, there is a need to analyse various socioeconomic factors to garner insights on the root causes for crimes against women to understand why this phenomenon is so.
OBJECTIVES
Our objectives of this project are as follows:
- Provide an overview of the issue of crimes against women in India
- Draw comparisons to study the differences in crime rates between different states
- Study the effect of various socioeconomic factors on the number of crimes committed against women
We hope to achieve these objectives by developing interactive visualisations which can help us to understand the increasing trend of crimes against women, and what factors may contribute to such crime rates.
DATA SOURCES
We have obtained the following datasets for this research:
| Dataset/Source | Data Attributes | Purpose |
|---|---|---|
(Click to View Data) District-wise Crimes Committed Against Women, 2014 (Click to View Data) |
|
|
(Click to View Data) dstrCAW_1 (2001-2012) (Click to View Data) |
|
|
(2007 - 2018) |
|
|
LITERATURE REVIEW
CONSIDERATION & VISUAL SELECTION
BRAINSTORMING SESSIONS
TECHNOLOGIES
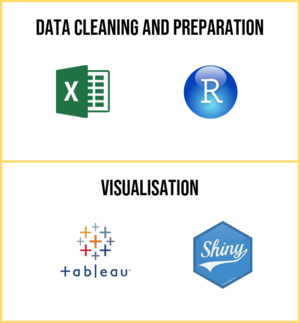
The tools we will be using for this Project is as follows:

CHALLENGES
| Challenges | Mitigation Plan |
|---|---|
|
Lack of proficiency in using R and R Shiny |
|
|
District Crime Rates are in separate files, with different data attributes. |
|
|
Difficulty in understanding some of the data attributes due to its local context, such as the different acts for protection against women found in some of our datasets. |
|
|
Difficulty in finding socioeconomic factors by state level |
|
|
The socioeconomic factors identified may not be indicative of the crime rate against women in India, as there may not be a relationship between the two. |
|
TIMELINE
COMMENTS
