Difference between revisions of "EzModel Proposal"
| Line 90: | Line 90: | ||
==<div style="background: #FFFFFF; padding-top: 20px; padding-bottom: 20px; line-height: 0.1em; text-indent: 3px; font-size:24px; font-family:Open Sans, Arial, sans-serif; border-bottom:solid #60c0a8;">Literature Review</div>== | ==<div style="background: #FFFFFF; padding-top: 20px; padding-bottom: 20px; line-height: 0.1em; text-indent: 3px; font-size:24px; font-family:Open Sans, Arial, sans-serif; border-bottom:solid #60c0a8;">Literature Review</div>== | ||
| − | == The Amaze-ing Corn == | + | == [https://stanleyadion.shinyapps.io/AmazeingCrop/ The Amaze-ing Corn] == |
'''Aim of study'''<br> | '''Aim of study'''<br> | ||
| Line 96: | Line 96: | ||
Explore the meteorology and geographical factors that makes a corn in USA, the a-maize-ing crop that we know today | Explore the meteorology and geographical factors that makes a corn in USA, the a-maize-ing crop that we know today | ||
| − | [[File:1024px-DashboardView Group7.png| | + | [[File:1024px-DashboardView Group7.png|500px|frame|center]] |
| − | |||
| − | |||
<br> | <br> | ||
Revision as of 12:01, 26 February 2019

Contents
Project Motivation
In recent decades, modeling housing prices has become a hot topic among economists, planners, and policymakers due to the significant role of properties in household wealth and national economy. In Singapore, public housing accommodates more than 80% of its citizen and citizens either choose to buy a new Housing Development Board (HDB) flat or purchase a HDB resale flat, second-hand flats with less than 99 years left on the lease. Our project will focus on modelling the HDB resale flat prices which are shaped by market forces.
In many existing hedonic housing prices models, linear regression is used to identify the significance of different variables (number of rooms, number of years left on the lease and distance from the nearest amenities etc.) on the house prices. However, these models fail to take into account the spatial variation in the nearby surroundings of these different resale units such as the proximity to shopping malls, number of MRT stations and healthcare facilities in the vicinity.
Geographically weighted regression (GWR) is a spatial analysis technique that overcomes this limitation by taking into account spatial autocorrelations among the observations in surrounding locations by allowing for spatial nonstationarity in the linear regression coefficients for each observation location. In this project, we will build a modeling tool that allows users to explore the impact of these spatial variations on HDB resale prices through a GWR model. To factor in the combination of both local and global variables, we also includes the option of using a mixed (semiparametric) GWR model.
Also, to provide greater flexibility for users to choose the certain desired spatial attributes that they would like to analyse, instead of fixing the datasets to be used for the model, we will allow users to upload datasets (i.e. school locations, hospital locations) and the tool will immediately compute new spatial variables for users to include in the model for analysis. This tool thus seeks to help users to accurately model the impact of spatial variables on the price of the HDB resale units.
Data Sources
| Data | Source | Data Type/Method |
|---|---|---|
| 2014 Master Plan Planning Subzone (Web) | Data.gov.sg | SHP |
| HDB Resale Flat Prices | Data.gov.sg | SHP Data was converted from CSV to Shapefile after geocoding HDB Addresses using OneMap API and further processing |
| Pre-Schools Location | Data.gov.sg | KML Converted to Shapefile |
| Schools Location | Data.gov.sg | CSV Data was geocoded using OneMap API |
| Hospital Locations | Hospitals.sg | Text List Data was geocoded into CSV using Google Geocoding API |
| Polyclinic Locations | Hospitals.sg | Text List Data was geocoded into CSV using Google Geocoding API |
| MRT/LRT Station Locations | LTA Datamall (Direct Download) |
SHP |
Literature Review
The Amaze-ing Corn
Aim of study
Explore the meteorology and geographical factors that makes a corn in USA, the a-maize-ing crop that we know today

Methodology
- Geographically weighted regression to analyse the natural factors that affect corns’ yield
- Inverse Distance Weighted technique to visualise and analyse the natural factors on an isoline map
Learning Points
- Spatial Analysis Techniques
- Learn how to enable users to select and drop variables for geographical weighted modeling on the RShiny Application
- Learn to use the gstat library to plot an isoline map for better analysis of the spatial variables
Area for Improvement
- Possible use of mixed geographically weighted regression model to account for global variables instead of assuming all are local variables in a typical GWR model
Approach
After conducting the literature review, our team is clearer on the approach that our application will have in allowing users to define their overall model.
Collinearity
As users will be working with multiple independent variables, it is undesirable for the model to include independent variables that are high in collinearity with respect to each other as this will result in multicollinearity. Hence, after selecting the variables that the user wants to include in the model, a plot of the correlation matrix between each variable with each other will be available for the user to filter out variables that present high correlation with another variable.
Global Regression
A global regression model using the selected independent variables will be run, with the output of the coefficients estimates as well the resulting t-statistic and p-value used to determine if the independent variable should remain in the model. This would be done based on the criteria set by the user on the confidence level required. Thus, previously selected variables that turn out to be insignificant to the overall model will be excluded to help users derive a more accurate model.
Geographically Weighted Regression
The advantage of using a GWR, as highlighted previously (link to Project Motivation), takes into account spatial nonstationarity in terms of the coefficients of each variable for each observation in the resulting regression model. This results in an equation as such:
Where the intercepts and the coefficients are varied according to the location of the observation and the surrounding observations in the spatial context.
Thus, there are a few parameters that have to be calibrated before running the GWR. Firstly, as different observations will be assigned different weights depending on the location with respect to each point, a weighting kernel function has to be decided upon to determine the allocation of weights to each observation according to distance. This is in contrast with the global function, which gives equal weightage to all observations.
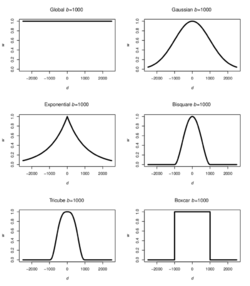
Such kernel functions include:
- Gaussian
- Exponential
- Box-car
- Bi-square
- Tri-cube.
The functions can be categorised into two main types: Continuous and Discountinuous. Continuous functions include the Gaussian and Exponential kernels, where weightage decreases gradually as distance increases. Even beyond the determined bandwidth, observations are still assigned a weightage, although the weightage is very small. Whereas discontinuous functions include the Box-car, Bi-square and Tri-cube kernels, whereby observations’ weightages are reduced to zero once distance between observation and the center-point exceeds the specified bandwidth.
Secondly, another parameter that has to be calibrated for the GWR model would be the weighting scheme. In essence, there are two main weighting schemes: Fixed and Adaptive. This is largely tied in with the third parameter to be customised: bandwidth. In a fixed weighting scheme, the same bandwidth is applied to all observations when applying the weighting kernel function. This, however, might cause issues whereby there are lesser observations taken into account in areas where data points are sparse, and more points included in areas where observations are dense. This is where an adaptive weighting scheme applies, in which bandwidth is adjusted according to the context of each observation, for example, to a pre-determined k nearest neighbours. Thus where data points are sparse, bandwidth increases, and where data points are dense, bandwidth is reduced.
Lastly, the method to determining bandwidth also has to be calibrated for the model. Aside from the user entering a pre-defined bandwidth, there are two other possible methods. Firstly, the Least Cross-Validation (CV) score method helps determine a bandwidth based on minimizing squared errors. The other method would be using the Least Akaike Information Criterion (AIC) method that takes into account different degrees of freedom for varying models from the different observations.
Due to the fact that the use of different kernel functions, weighting schemes, as well as bandwidth determination methods will affect the overall GWR model output, we want to give users the ability to calibrate their model based on these parameters based on what they wish to explore, or based on what they deem is most appropriate for the variables selected.
Mixed (Semiparametric) GWR
The mixed GWR model, as suggested by its name, allows for a mix of both analysis variables that will be regressed according to the geographic weights of the observations around it, as well as variables in which coefficients estimates derived from a global regression will be kept constant throughout all observations and resulting models. For example, the coefficient for which the floor range of a flat affects its resale price might be deemed to be/approximately constant throughout observations. Hence, this Floor Range variable could be selected to be a variable in which its coefficient estimate would be globally applied to all the resulting mixed GWR models.
Users can experiment in creating an optimal model by selecting independent variables in which they want the coefficient estimates to be kept global, while leaving the other variables to be run against the GW regression.
Isoline Map
<Insert Here>
Project Timeline
Challenges
Tools & Technology