Difference between revisions of "ELECgrid Proposal"
| Line 37: | Line 37: | ||
| − | <div style="padding: 20px; line-height: 0.3em; letter-spacing:0.1em; font-size:150%; font-weight:bold; text-align: | + | <div style="padding: 20px; line-height: 0.3em; letter-spacing:0.1em; font-size:150%; font-weight:bold; text-align:center; margin-left: 5em; margin-right: 5em;"><font color=#000 face="Tw Cen MT">PROJECT OBJECTIVES</font></div> |
<div style= "text-align: justify; margin-left: 10em; margin-right: 10em; font-size: 18px;"> | <div style= "text-align: justify; margin-left: 10em; margin-right: 10em; font-size: 18px;"> | ||
To provide an estimate of the monthly electricity consumption by dwelling type. | To provide an estimate of the monthly electricity consumption by dwelling type. | ||
| Line 45: | Line 45: | ||
| − | <div style="padding: 20px; line-height: 0.3em; letter-spacing:0.1em; font-size:150%; font-weight:bold; text-align: | + | <div style="padding: 20px; line-height: 0.3em; letter-spacing:0.1em; font-size:150%; font-weight:bold; text-align:center; margin-left: 5em; margin-right: 5em;"><font color=#000 face="Tw Cen MT">PROJECT MOTIVATION</font></div> |
<div style= "text-align: justify; margin-left: 10em; margin-right: 10em; font-size: 18px;"> | <div style= "text-align: justify; margin-left: 10em; margin-right: 10em; font-size: 18px;"> | ||
The topic on the privatisation of the electricity market stirred our curiosity and we decided to look at some of the challenges faced by the private electricity retailers. Through our discussions, we realised the importance of a more robust forecast for electricity demand. This includes cost-savings for the retailers, which will eventually be passed on to the consumers. Hence, using the knowledge of geospatial analytics, we would like to tackle this issue. | The topic on the privatisation of the electricity market stirred our curiosity and we decided to look at some of the challenges faced by the private electricity retailers. Through our discussions, we realised the importance of a more robust forecast for electricity demand. This includes cost-savings for the retailers, which will eventually be passed on to the consumers. Hence, using the knowledge of geospatial analytics, we would like to tackle this issue. | ||
Revision as of 13:12, 5 March 2019
[File:.png|frameless|center|500px]]
As we speak, Singapore is rolling out its plan for the privatisation of the electricity market. There are currently as many as 12 electricity retailers competing to sell their energy package, and each retailer charges a price lower than the tariff price set by Singapore Power - the de facto energy retailer. These retailers also purchase electricity in bulk from electricity-generating companies instead of producing their own, subsequently selling the resource to their customers.
One of the challenges faced by these retailers is the lack of accurate demand forecast for electricity. This is a key issue as a poor forecast of demand for electricity results in the resource being wasted and revenue lost for the company.
Our project therefore aims to estimate the total monthly electricity consumption per housing units to provide these electricity retailers a picture of how much electricity is needed in the grid.
To provide an estimate of the monthly electricity consumption by dwelling type.
The topic on the privatisation of the electricity market stirred our curiosity and we decided to look at some of the challenges faced by the private electricity retailers. Through our discussions, we realised the importance of a more robust forecast for electricity demand. This includes cost-savings for the retailers, which will eventually be passed on to the consumers. Hence, using the knowledge of geospatial analytics, we would like to tackle this issue.
| Data Set | Format | Attributes |
|---|---|---|
| Average Monthly Household Electricity Consumption Jan- June 2016 | xls |
|
| Average Monthly Household Electricity Consumption Jul- Dec 2016 | xls |
|
| Master-plan-2014-subzone-boundary-web | shapefile |
|
| Singapore-residents-by-subzone-age-group-and-sex-jun-2017-gender | kml |
|
1. Small Area Estimate (SAE) - SAE is a statistical technique which involves estimating parameters for small sub-populations.
2. Geographic segmentation with spatially constrained cluster analysis
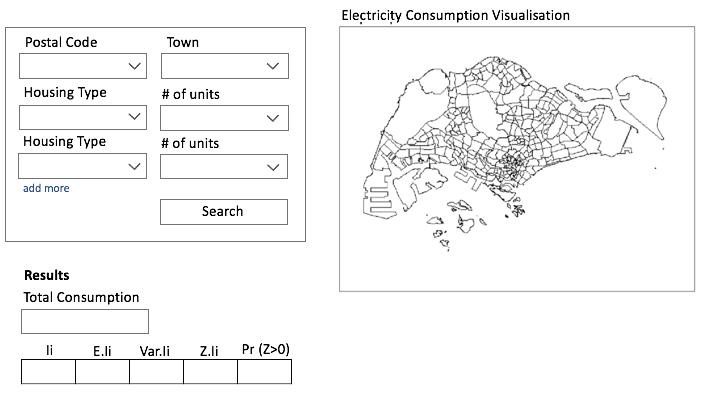
3. R Shiny Applications

