Difference between revisions of "BURP Proposal"
| Line 138: | Line 138: | ||
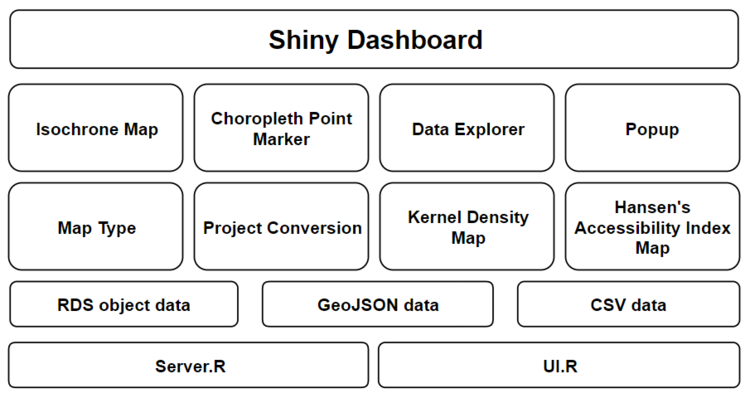
<br>[[File:Design Architecture.png|frameless|center|750px]] | <br>[[File:Design Architecture.png|frameless|center|750px]] | ||
<!-- End of Design Architecture---> | <!-- End of Design Architecture---> | ||
| + | |||
<br> | <br> | ||
<div style="background: #f6c630; padding: 20px; line-height: 0.3em; letter-spacing:0.1em; font-size:150%; font-weight:bold; text-align: center; margin-left: 5em; margin-right: 5em;"><font color=#000 face="Tw Cen MT">USER INTERFACE</font></div> | <div style="background: #f6c630; padding: 20px; line-height: 0.3em; letter-spacing:0.1em; font-size:150%; font-weight:bold; text-align: center; margin-left: 5em; margin-right: 5em;"><font color=#000 face="Tw Cen MT">USER INTERFACE</font></div> | ||
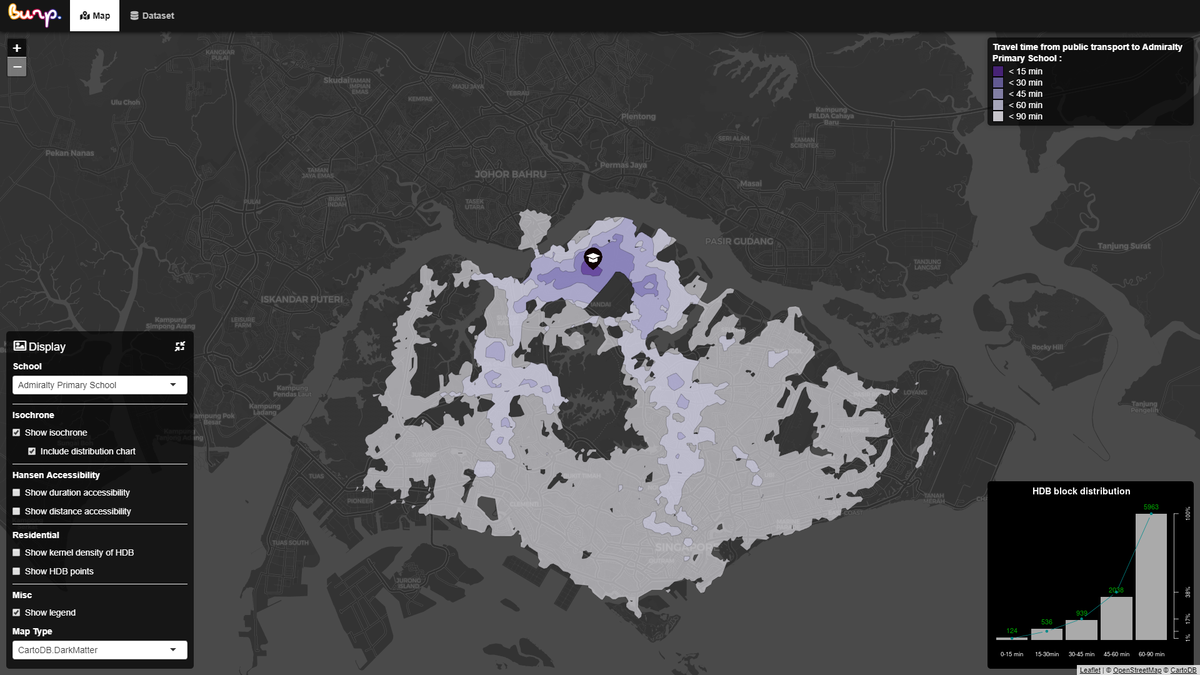
<br>[[File:User Interface.jpg|frameless|center|1200px]] | <br>[[File:User Interface.jpg|frameless|center|1200px]] | ||
<!-- End of User Interface---> | <!-- End of User Interface---> | ||
| + | <br> | ||
| + | |||
| + | <div style="padding: 20px; line-height: 0.3em; letter-spacing:0.1em; font-size:150%; font-weight:bold; text-align:left; margin-left: 5em; margin-right: 5em;"><font color=#000 face="Tw Cen MT">USERS' SETTINGS</font></div> | ||
| + | {| class="wikitable" style="background-color:#FFF; margin: 1em auto;" width="80%; font-size: 18px;" | ||
| + | |+ | ||
| + | |-style="font-size: 130%; | ||
| + | ! scope="col" style="width: 300px;"|<b>Image</b> | ||
| + | !<b>Explanation</b> | ||
| + | |-style="font-size: 130%; | ||
| + | | Picture | ||
| + | | Explanation | ||
| + | |} | ||
| + | <br> | ||
| + | <!-- End of User Settings---> | ||
| + | |||
<br> | <br> | ||
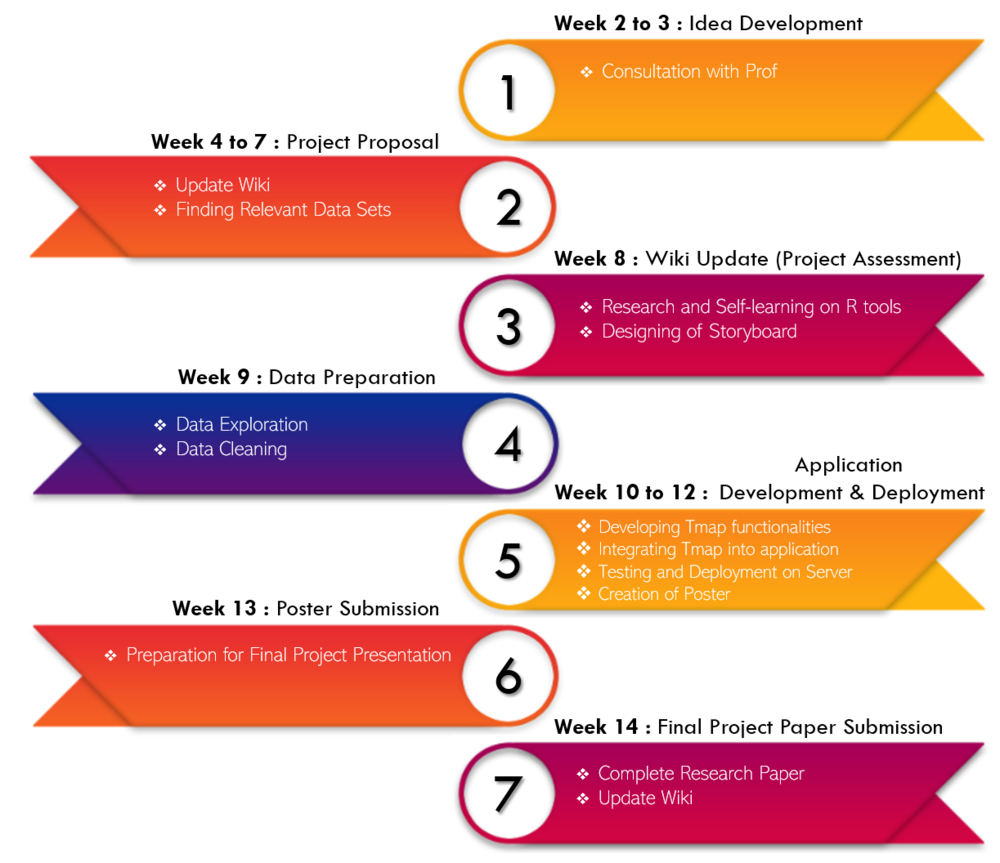
<div style="background: #f6c630; padding: 20px; line-height: 0.3em; letter-spacing:0.1em; font-size:150%; font-weight:bold; text-align: center; margin-left: 5em; margin-right: 5em;"><font color=#000 face="Tw Cen MT">PROJECT MILESTONES</font></div> | <div style="background: #f6c630; padding: 20px; line-height: 0.3em; letter-spacing:0.1em; font-size:150%; font-weight:bold; text-align: center; margin-left: 5em; margin-right: 5em;"><font color=#000 face="Tw Cen MT">PROJECT MILESTONES</font></div> | ||
Revision as of 16:41, 7 April 2019
In recent years, the Ministry of Education (MOE) has been appointing new mergers between schools and relocating them. This is due to an increase in Singapore aging population hence, there are lesser residents that requires education services from nearby schools. So the government have been coming up with more school mergers and these schools include primary schools, secondary schools as well as junior colleges. The merging and relocation of schools would mean lesser schools in each neighbourhood. This would affect the students' accessibility to certain schools, especially those in primary schools where parents need to send their children to schools. With more upcoming mergers of school by MOE, it is important for the government and schools to know the inconvenience in terms of time and distance travelled caused by the mergers and implement measures to ensure that these areas have better accessibility. Thus, our team aims to identify the HDB residential areas that are affected due to the merger of schools and through our application, we hope these affected areas gain attention from government to improve on their current accessibility.
Our project aims to identify the accessibility of Singapore’s residents to schools through public transport. This could assist the Government or MOE to take note of the areas which can be improved to serve the citizens better. Through this project, we aim to:
- Identify the accessibility of HDB residential areas to schools affected by the mergers.
- Analyze and highlight the affected HDB residential areas
- Building an application to project our ideas and insights obtained based on our findings.
Our team have decided take up to take up this project topic due to several reasons. The reasons include the followings:
- School mergers is an on-going plan by MOE and they have been planning to further increase the mergers due to the reduce in cohort size.
- It is quite impactful for the current students and parents which schools have been shifted.
- We are curious whether the MOE have ensure that there are equal accessibility for residents before assiging the mergers of the schools.
- If there are no equal accessibility, we would like to know which part of the residential areas that are most affected by these mergers so that the government is able to assist them in terms of accessibility.
Calculations of HDB flats to Desired Schools
- Obtain the distance and duration from the HDB flat to the nearest public transport, capping the maximum walking distance to 1.6 km.
- Get the total distance and duration of the public transport of their origin to the nearest public transport of their destination. This distance and duration is computed through the use of 357 schools, 9966 HDB flats, and 3 different routes using different public transports.<bt>
- Obtain the distance and duration from the public transport to the school. For the walking distance, we would use walking/road path as means to reach the public transport/destination.
Servers
- Using OpenTripPlanner, we generate the different routes of the public transport on the map to get the duration and distance through running a local instance of OpenTripPlanner.
Files
- To reduce the time taken to process and load the application, we store data that are large into R objects (i.e. rds file) that could be restored easily.
| Data Set | Format | Attributes | Source Link |
|---|---|---|---|
| HDB Property Information | CSV |
|
https://data.gov.sg/dataset/hdb-property-information |
| Postal Code Data | CSV |
|
https://docs.onemap.sg/#authentication-service-post |
| General Information of Schools | CSV |
|
https://data.gov.sg/dataset/school-directory-and-information?view_id=ba7c477d-a077-4303-96a1-ac1d4f25b190&resource_id=ede26d32-01af-4228-b1ed-f05c45a1d8ee |
| Route Data | CSV |
|
https://cran.r-project.org/web/packages/osrm/index.html |
| General Transit Feed Specification | API |
|
https://transit.land/documentation/ |
| OpenTripPlanner | PBF |
|
https://transit.land/documentation/ |
| Image | Explanation |
|---|---|
| Picture | Explanation |
| Iteration | Week | Task | In-charge |
|---|---|---|---|
| 1 and 2 | Week 2 to 7 | Idea Development and Project Proposal | All |
| 3 | Week 8 | Wiki Update (Project Assessment) | Rebecca |
| 4 | Week 9 | Data Preparation | Peng Chong |
| 5 | Week 10 to 12 | Application Development and Deployment | Brendo and Peng Chong |
| 6 | Week 13 | Poster Submission | Brendo and Rebecca |
| 7 | Week 14 | Final Project Paper Submission | All |
| Key Challenges | Description | Solution |
|---|---|---|
| Cross Referencing of Data | As there are many datasets involved, it is difficult to cross reference the data as they are of different level. |
|
| Restriction of Public Api | To calibrate data on routes, we used public api. However, the public api do not allow us to call more than 10,000 times. |
|


