Difference between revisions of "Group06 Elec3city Proposal"
| Line 77: | Line 77: | ||
|[https://www.singstat.gov.sg/-/media/files/find_data/population/statistical_tables/respoptod2000to2018.zip Singapore Residents by Planning Area/Subzone and Type of Dwelling, June 2000 - 2018] ||Department of Statistics Singapore (singstat.gov.sg)|| csv | |[https://www.singstat.gov.sg/-/media/files/find_data/population/statistical_tables/respoptod2000to2018.zip Singapore Residents by Planning Area/Subzone and Type of Dwelling, June 2000 - 2018] ||Department of Statistics Singapore (singstat.gov.sg)|| csv | ||
|- | |- | ||
| − | |[http://www.weather.gov.sg/climate-historical-daily Singapore Climate Historical Data] ||Meteorological Service Singapore (weather.gov.sg)|| csv | + | |[http://www.weather.gov.sg/climate-historical-daily Singapore Climate Historical Data - crawled to get temperature and rain data from 2013 to 2016 at daily granularity] ||Meteorological Service Singapore (weather.gov.sg)|| csv |
|} | |} | ||
Revision as of 17:15, 10 March 2019
Contents
Project Motivation
When it comes to the government’s push for efficient energy usage, most effort is expended on the efficiency of energy sources – e.g. using less carbon-intensive fuels (https://www.nea.gov.sg/our-services/climate-change-energy-efficiency/energy-efficiency/energy-efficient-singapore). However, hitherto, there has been scant statistical analysis on possible causes of inexpedient energy usage by households, with consideration of their varied age structure and the geospatial variation of environmental conditions (e.g. temperature’s effect on energy consumption).
Our team sees geospatial analytical tools (such as R) as thus far largely unexploited in exploring the origins of geospatial variation in energy consumption and is thus using spatial interpolation techniques (such as kriging) to provide an app which allows for authorities in Singapore such as the National Environment Agency to understand with data-driven evidence the origins of variation in Singapore household energy consumption so as to have more targeted efforts to reduce energy wastage.
Project Objective
Deliver a dynamic (interactive) application that provides authorities such as the National Environment Agency and Housing Development Board with the ability to:
- View monthly and yearly temperature geospatial variation in Singapore, and compare that to energy consumption at building level granularity
- View housing composition (e.g. age, income and race) geospatial variation, and compare that to energy consumption at a building level granularity
so as to make data-informed, targeted decisions to promote reduction of energy usage among varying types of households in Singapore, where hitherto there has been a blanket approach.
Data
Literature Review
Methodology:
Learning Points:
Areas for improvement:
Approach
Techniques:
Web Application Design
Design Inspiration
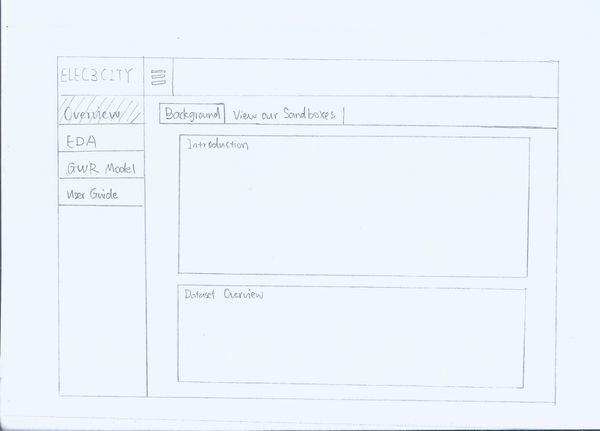
The dashboard design is inspired by https://stanleyadion.shinyapps.io/AmazeingCrop
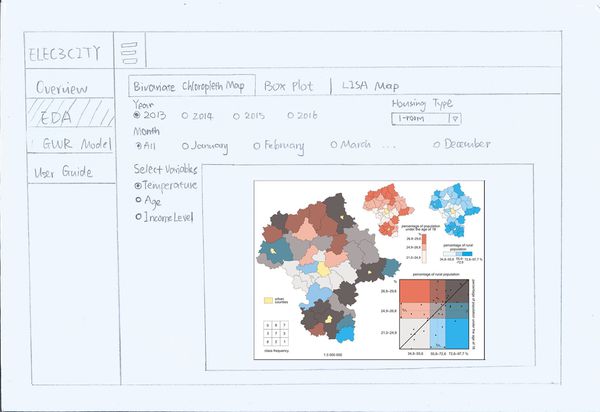
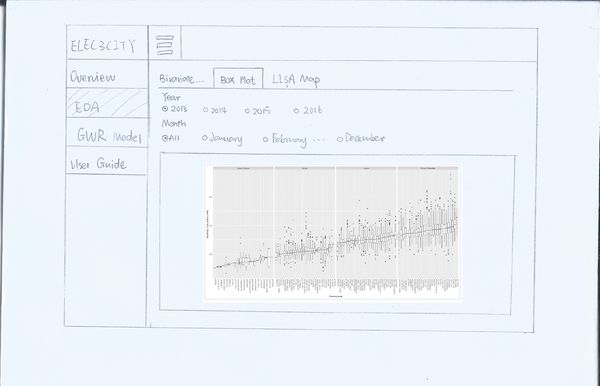
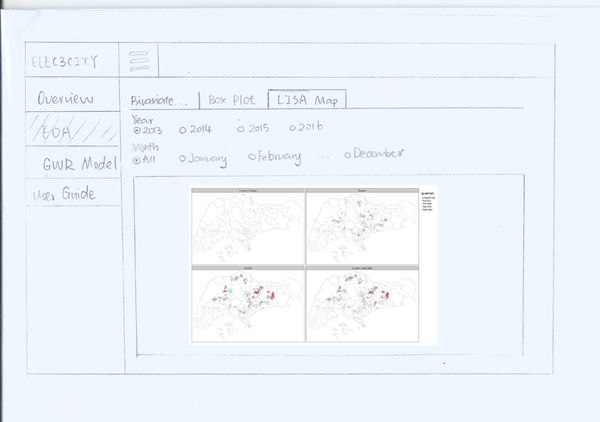
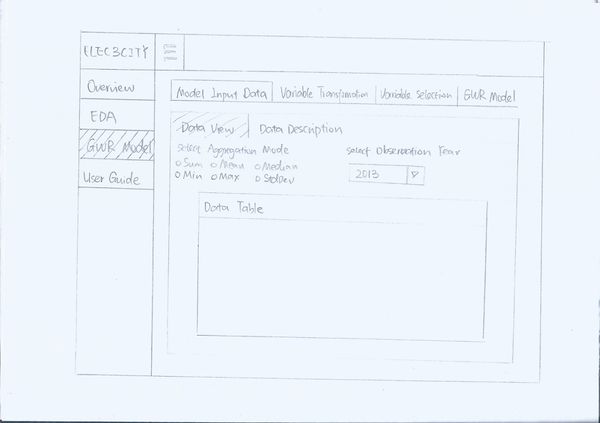
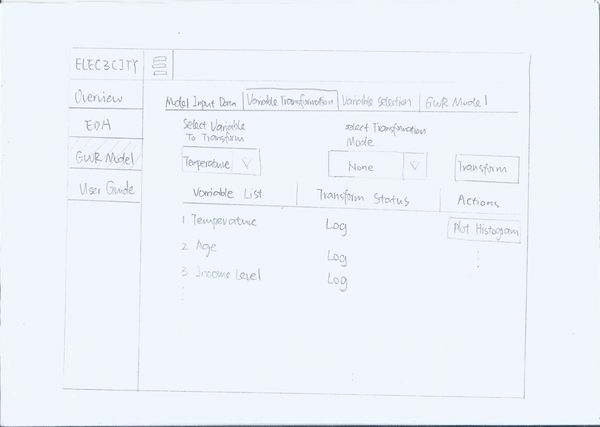
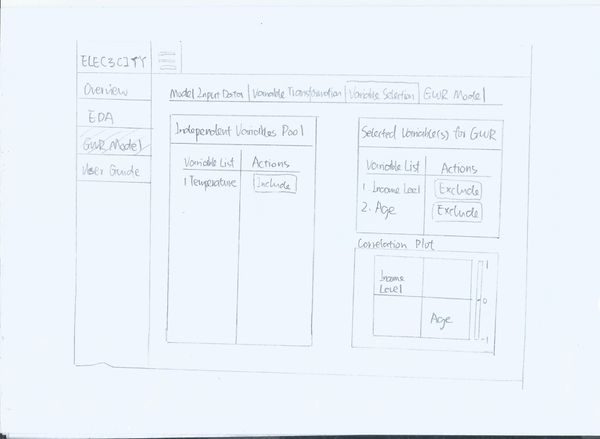
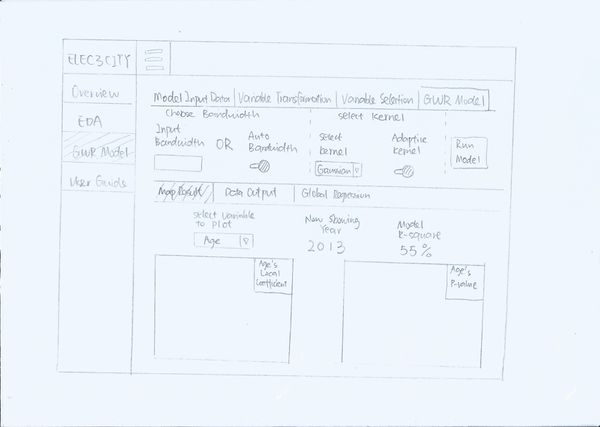
Initial Storyboard
Project Challenges
| Key Challenges | Description | Solution | |
|---|---|---|---|
| 1. | Technical Challenge | The proposed geovisualization including bivariate choropleth maps and box-plots by planning zones and dwelling type is complex. The group may encounter technical challenges such as finding relevant R packages and functions when building the visualization. |
|
| 2. |
| ||
| 3. |
|
Project Timeline
|
No. |
Name |
Date |
Comments |
|
1. |
Insert your Name here |
Insert Date here |
Insert Comment here |
|
2. |
Insert your Name here |
Insert Date here |
Insert Comment here |
|
3. |
Insert your Name here |
Insert Date here |
Insert Comment here |
