Difference between revisions of "Dangy Proposal"
| (26 intermediate revisions by 3 users not shown) | |||
| Line 4: | Line 4: | ||
{| style="background-color:#ffffff ; margin: 3px 10px 3px 10px; width="80%"| | {| style="background-color:#ffffff ; margin: 3px 10px 3px 10px; width="80%"| | ||
| − | | style="font-family:Open Sans, Arial, sans-serif; font-size:15px; text-align: center; border-top:solid #ffffff; border-bottom:solid #f5f5f5" width=" | + | | style="font-family:Open Sans, Arial, sans-serif; font-size:15px; text-align: center; border-top:solid #ffffff; border-bottom:solid #f5f5f5" width="190px" | |
[[Dangy|<font color="#3c3c3c"><strong>HOME</strong></font>]] | [[Dangy|<font color="#3c3c3c"><strong>HOME</strong></font>]] | ||
| − | | style="font-family:Open Sans, Arial, sans-serif; font-size:15px; text-align: center; border-top:solid #ffffff; border-bottom:solid #7A9FC4" width=" | + | | style="font-family:Open Sans, Arial, sans-serif; font-size:15px; text-align: center; border-top:solid #ffffff; border-bottom:solid #7A9FC4" width="210px" | |
[[Dangy_Proposal|<font color="#3c3c3c"><strong>PROPOSAL</strong></font>]] | [[Dangy_Proposal|<font color="#3c3c3c"><strong>PROPOSAL</strong></font>]] | ||
| Line 15: | Line 15: | ||
| style="font-family:Open Sans, Arial, sans-serif; font-size:15px; text-align: center; border-top:solid #ffffff; border-bottom:solid #f5f5f5" width="230px" | | | style="font-family:Open Sans, Arial, sans-serif; font-size:15px; text-align: center; border-top:solid #ffffff; border-bottom:solid #f5f5f5" width="230px" | | ||
[[Dangy_Project_Application|<font color="#3c3c3c"><strong>APPLICATION</strong></font>]] | [[Dangy_Project_Application|<font color="#3c3c3c"><strong>APPLICATION</strong></font>]] | ||
| + | |||
| + | | style="font-family:Open Sans, Arial, sans-serif; font-size:15px; text-align: center; border-top:solid #ffffff; border-bottom:solid #f5f5f5" width="230px" | | ||
| + | [[Dangy_Research_Paper|<font color="#3c3c3c"><strong>RESEARCH PAPER</strong></font>]] | ||
|} | |} | ||
| Line 21: | Line 24: | ||
<!-- Body --> | <!-- Body --> | ||
<br> | <br> | ||
| + | |||
| + | {| style="background-color:#ffffff ; margin: 3px 10px 3px 10px; width="80%"| | ||
| + | |||
| + | | style="font-family:Open Sans, Arial, sans-serif; font-size:24px; border-top:solid #ffffff; border-bottom:solid #7A9FC4" width="1200px" | Introduction | ||
| + | |} | ||
| + | Dengue fever has for centuries been a prominent epidemic disease that plagued humanity. While normal dengue infections take approximately a week to recover, complications like dengue haemorrhagic fever and dengue shock syndrome can be extremely severe, causing death. Today, even with our advanced healthcare and technology, there remains no proper cure or vaccine to combat the disease. This has allowed dengue fever to stay rampant in both developed and developing countries. | ||
| + | |||
| + | Consider Taiwan, a country that has proven itself through its evident economic growth and development. Even with healthcare services that meets international standards, Taiwan continue to stay susceptible to dengue fever. In fact, One of Taiwan’s health catastrophe was the 2015 dengue outbreak. From 2015 to 2016, there were 15,732 DF cases reported. Then, amongst the reported cases, 136 of them resulted in dengue haemorrhagic fever (DHF), of which 20 patients died. | ||
| + | |||
| + | We can see that dengue fever cannot be underestimated. Like any other epidemical diseases, it can have a ripple‐effect on its transmission resulting to an exponential increase of cases. Maintenance and prevention should always be done in order to reduce the possibility of its spread. This is especially so, considering how there are no vaccine or specific therapy for dengue fever. This leaves us with implementing effective control measures to combat the disease, which is what this study is about: to find potential areas where control measures can be implemented. | ||
| + | |||
{| style="background-color:#ffffff ; margin: 3px 10px 3px 10px; width="80%"| | {| style="background-color:#ffffff ; margin: 3px 10px 3px 10px; width="80%"| | ||
| Line 27: | Line 41: | ||
|} | |} | ||
| − | + | Our project goal is to study the possible spreading pattern of dengue fever and offer potential countermeasures to contain its spread. Previous researches on dengue fever generally studied factors contributing to the breeding of Aedes mosquitoes or the disease’s outbreak. To achieve this, most researchers have delved into spatial analysis, utilizing models such as Geographical Weighted Regression (GWR), Moran I and Geary C statistics. To enhance their spatial analyses, some have also combined their studies with temporal analysis to identify the patterns of dengue fever’s outbreak. However, these researches conducted their temporal analysis at a large timeframe, which provided an overview of the distribution of dengue cases in a region and not how the disease spread. Though managing the disease's origin is important, it is also important for us to learn more about how to contain the spread of the disease when it occurs. | |
| + | |||
| + | In the previous section, we mentioned briefly about Taiwan. Data about dengue fever in Taiwan is readily available for analysis. Also, considering how Taiwan has a good mix of different settlements and terrains, it is a good case study for us to conduct our research. To scope our research, we will be focusing on the major dengue outbreak that has happened in 2015. | ||
| + | |||
| + | <br> | ||
| + | {| style="background-color:#ffffff ; margin: 3px 10px 3px 10px; width="80%"| | ||
| + | |||
| + | | style="font-family:Open Sans, Arial, sans-serif; font-size:24px; border-top:solid #ffffff; border-bottom:solid #7A9FC4" width="1200px" | Data Sources | ||
| + | |} | ||
| + | |||
| + | <table class="wikitable"> | ||
| + | <tr> | ||
| + | <th> Data </th> | ||
| + | <th> Source </th> | ||
| + | <th> Remarks | ||
| + | </th> | ||
| + | </tr> | ||
| + | |||
| + | |||
| + | <tr> | ||
| + | <td>Taiwan Main Island (level I administrative boundaries)</td> | ||
| + | <td> [https://data.gov.tw/dataset/7442| data.gov.tw] </td> | ||
| + | <td> Municipality, county and city level I administrative boundaries of the main Taiwan island retrieved from the Ministry of Interior Land Surveying and Mapping Center. </td> | ||
| + | </tr> | ||
| − | + | <tr> | |
| + | <td>Taiwan Boundaries (level III administrative boundaries) </td> | ||
| + | <td> [https://whgis.nlsc.gov.tw/English/5-1Files.aspx|Taiwan Map Store] </td> | ||
| + | <td> Municipality, county and city level III administrative boundaries of the greater Taiwan region retrieved from the National Land Surveying and Mapping Center (Ministry of the Interior)</td> | ||
| + | </tr> | ||
| + | <tr> | ||
| + | <td>Taiwan's Daily confirmed dengue cases</td> | ||
| + | <td> [https://data.cdc.gov.tw/en/dataset/dengue-daily-determined-cases-1998-moi|Open Data Portal] </td> | ||
| + | <td>Dengue daily confirmed cases since 1998 retrieved from the Taiwan CDC (Centers for Disease Control)</td> | ||
| + | </tr> | ||
| + | |||
| + | </tr></table> | ||
{| style="background-color:#ffffff ; margin: 3px 10px 3px 10px; width="80%"| | {| style="background-color:#ffffff ; margin: 3px 10px 3px 10px; width="80%"| | ||
| Line 55: | Line 103: | ||
Taiwan geographical data we sourced have slightly different county namings from the google translations we received. For example, Google Translation offers translation of “Taipei City” while Taiwan geographical data contains only “Taipei”. Hence further data transformation is required to standardise the county namings. Our team creates a dictionary to store words which involve translation discrepancies and replace the word using vlookup in Excel. | Taiwan geographical data we sourced have slightly different county namings from the google translations we received. For example, Google Translation offers translation of “Taipei City” while Taiwan geographical data contains only “Taipei”. Hence further data transformation is required to standardise the county namings. Our team creates a dictionary to store words which involve translation discrepancies and replace the word using vlookup in Excel. | ||
| + | |||
| + | {| style="background-color:#ffffff ; margin: 3px 10px 3px 10px; width="80%"| | ||
| + | |||
| + | | style="font-family:Open Sans, Arial, sans-serif; font-size:24px; border-top:solid #ffffff; border-bottom:solid #7A9FC4" width="1200px" | Academic References | ||
| + | |} | ||
| + | |||
| + | <b> I.“Spatio-temporal patterns of dengue fever cases in Kaoshiung City, Taiwan, 2003-2008” </b> | ||
| + | |||
| + | The literature was conducted in 2012 driven by the observation of how dengue has been a serious vector-borne disease with a worldwide incidence and was considered to be a pandemic disease. The study takes place in Kaoshiung City, Taiwan between 2003-2008. The geocoded dengue cases was analysed using geospatial analysis to understand the spatio-temporal patterns through hot spot/cold spot analysis and geographically weighted regression models over time space. The study has concluded that to some degree, cases were correlated to its population density, transportation arteries, and water bodies. | ||
| + | |||
| + | <b> II. “stpp: Plotting, Simulating and Analyzing Spatio-Temporal Point Patterns”</b> | ||
| + | |||
| + | Some spatial processes of scientific interest has a temporal aspect that may be accounted when modelling the case such as the distribution of cases for diseases or assessing risks of air pollution. As such, spatio-temporal point processes has to be weighted in, rather than purely spatial point processes. In the journal, the authors conducted an analysis on the first-order properties which describes intensity of the process: | ||
| + | |||
| + | [[File:Formula2.jpg|center|200px]] | ||
| + | |||
| + | where ds defines a sliced region around study area (s) and dt as a interval time in an overall time in data (t). Thus, informally, λ(s,t) is the mean number of events per unit volume at the location (s,t) which will be applied in understanding the dengue case transmission in this research. The second-order process applies the covariance density, radial distribution function/point-pair correlation function to derive a standardised probability density y that an event occurs in each of two small volumes centred on 2 spatial points (si,ti) and (sj,tj). | ||
| + | |||
| + | {| style="background-color:#ffffff ; margin: 3px 10px 3px 10px; width="80%"| | ||
| + | |||
| + | | style="font-family:Open Sans, Arial, sans-serif; font-size:24px; border-top:solid #ffffff; border-bottom:solid #7A9FC4" width="1200px" | Overview System Architecture Diagram | ||
| + | |} | ||
| + | [[File:Diagram.jpg|center]] | ||
{| style="background-color:#ffffff ; margin: 3px 10px 3px 10px; width="80%"| | {| style="background-color:#ffffff ; margin: 3px 10px 3px 10px; width="80%"| | ||
| Line 62: | Line 133: | ||
[[File:Paper Prototype 1.jpg|center|800px]] | [[File:Paper Prototype 1.jpg|center|800px]] | ||
| + | |||
| + | {| style="background-color:#ffffff ; margin: 3px 10px 3px 10px; width="80%"| | ||
| + | |||
| + | | style="font-family:Open Sans, Arial, sans-serif; font-size:24px; border-top:solid #ffffff; border-bottom:solid #7A9FC4" width="1200px" | Application Overview | ||
| + | |} | ||
| + | |||
| + | {| style="background-color:#ffffff ; margin: 3px 10px 3px 10px; width="80%"| | ||
| + | |||
| + | | style="font-family:Open Sans, Arial, sans-serif; font-size:18px; border-top:solid #ffffff; border-bottom:solid #ffffff" width="1200px" | 1. Exploratory Data Analysis (EDA) | ||
| + | |} | ||
| + | |||
| + | [[File:Eda.jpg|center|800px]] | ||
| + | |||
| + | The Exploratory Data Analysis (EDA) section plots a macro level of dengue data cases through points projected on top of Taiwan’s OpenStreetMap layer. Each data points includes attributes such as onset date, case study date, gender, age group, living county, living townshi, residential village, infected countries and cities, infected village, and etc. | ||
| + | |||
| + | Macro level data points overview through EDA gives a short view of particularly in which area most events happened. EDA enables user to draw general conclusion or hypothesis by providing the ability to slice all data points by yearly, 12 weeks date range, and lastly 14 days date range that represents approximately the amount of days needed to identify dengue fever. | ||
| + | |||
| + | Additionally, EDA provides function such as case count over years, case count over month, cases count per week, and lastly distribution of attributes such as age, gender and subzone dependent on the selected date filter. Case counts by year/month will be aggregated independent to the selected time interval. | ||
| + | |||
| + | {| style="background-color:#ffffff ; margin: 3px 10px 3px 10px; width="80%"| | ||
| + | |||
| + | | style="font-family:Open Sans, Arial, sans-serif; font-size:18px; border-top:solid #ffffff; border-bottom:solid #ffffff" width="1200px" | 2. Kernel Density Estimation Animation | ||
| + | |} | ||
| + | |||
| + | [[File:Kde2.jpg|center|border|800px]] | ||
| + | |||
| + | The spatial temporal analysis gives users the ability to animate the dengue outbreak distribution according to date range with parameters such as regions, density’s sigma, number of bins, and kernel function. Moreover, the spatial temporal kernel density enables user to analyse in a local administrator counties available to understand trends from the kernel smoothed intensity. | ||
| + | |||
| + | {| style="background-color:#ffffff ; margin: 3px 10px 3px 10px; width="80%"| | ||
| + | |||
| + | | style="font-family:Open Sans, Arial, sans-serif; font-size:18px; border-top:solid #ffffff; border-bottom:solid #ffffff" width="1200px" | 3. Dengue Spread Analysis | ||
| + | |} | ||
| + | [[File:Stpp2.jpg|center|border|800px]] | ||
| + | [[File:Stpp.gif|right|300px]] | ||
| + | <br> | ||
| + | Understanding trends from the kernel density estimation gives the ability to view the intensity according to indicated bandwidth of a point. However, in the light of understanding the how the dengue case spreads require spatio-temporal dimension to be accounted for. The dengue spread analysis function provides user the possibility to simulate dengue case appearance through the selected time range. The possibility is also completed by the x-y-t spatio-temporal, cumulative number and space-mark graphical representation. | ||
| + | |||
| + | The ability to show how geocoded points were added across time will give a simulation of where it started, how spreads, where and when it stopped spreading. Here there are even more possible statistical studies to be conducted as we recognise and gather revelations from the spatio-temporal data and thus giving the ability for users to identify general insights and come up with hypothesis. | ||
| + | |||
| + | {| style="background-color:#ffffff ; margin: 3px 10px 3px 10px; width="80%"| | ||
| + | |||
| + | | style="font-family:Open Sans, Arial, sans-serif; font-size:18px; border-top:solid #ffffff; border-bottom:solid #ffffff" width="1200px" | 4. Datatable | ||
| + | |} | ||
| + | [[File:Datatable.jpg|center|border|800px]] | ||
| + | |||
| + | The datasets provided by the Taiwan Centers for Disease Control (CDC) includes the possible infected country, counties and infected village for each dengue cases. This opens up the possibility to draw correlation in which and where the dengue cases were infected from. The aggregated datatable function is complete with search, filtering, and sorting capability to give users the freedom to explore. However in this case, there is a possibility that the infected subject of dengue case was a carrier of Taiwan. | ||
| + | |||
| + | |||
| + | {| style="background-color:#ffffff ; margin: 3px 10px 3px 10px; width="80%"| | ||
| + | |||
| + | | style="font-family:Open Sans, Arial, sans-serif; font-size:24px; border-top:solid #ffffff; border-bottom:solid #7A9FC4" width="1200px" | Project Timeline | ||
| + | |} | ||
| + | [[File:1 1.jpg|center|800px]] | ||
| + | [[File:2 2.jpg|center|800px]] | ||
| + | [[File:3 3.jpg|center|800px]] | ||
Latest revision as of 23:56, 14 April 2019
| Introduction |
Dengue fever has for centuries been a prominent epidemic disease that plagued humanity. While normal dengue infections take approximately a week to recover, complications like dengue haemorrhagic fever and dengue shock syndrome can be extremely severe, causing death. Today, even with our advanced healthcare and technology, there remains no proper cure or vaccine to combat the disease. This has allowed dengue fever to stay rampant in both developed and developing countries.
Consider Taiwan, a country that has proven itself through its evident economic growth and development. Even with healthcare services that meets international standards, Taiwan continue to stay susceptible to dengue fever. In fact, One of Taiwan’s health catastrophe was the 2015 dengue outbreak. From 2015 to 2016, there were 15,732 DF cases reported. Then, amongst the reported cases, 136 of them resulted in dengue haemorrhagic fever (DHF), of which 20 patients died.
We can see that dengue fever cannot be underestimated. Like any other epidemical diseases, it can have a ripple‐effect on its transmission resulting to an exponential increase of cases. Maintenance and prevention should always be done in order to reduce the possibility of its spread. This is especially so, considering how there are no vaccine or specific therapy for dengue fever. This leaves us with implementing effective control measures to combat the disease, which is what this study is about: to find potential areas where control measures can be implemented.
| Project Objective |
Our project goal is to study the possible spreading pattern of dengue fever and offer potential countermeasures to contain its spread. Previous researches on dengue fever generally studied factors contributing to the breeding of Aedes mosquitoes or the disease’s outbreak. To achieve this, most researchers have delved into spatial analysis, utilizing models such as Geographical Weighted Regression (GWR), Moran I and Geary C statistics. To enhance their spatial analyses, some have also combined their studies with temporal analysis to identify the patterns of dengue fever’s outbreak. However, these researches conducted their temporal analysis at a large timeframe, which provided an overview of the distribution of dengue cases in a region and not how the disease spread. Though managing the disease's origin is important, it is also important for us to learn more about how to contain the spread of the disease when it occurs.
In the previous section, we mentioned briefly about Taiwan. Data about dengue fever in Taiwan is readily available for analysis. Also, considering how Taiwan has a good mix of different settlements and terrains, it is a good case study for us to conduct our research. To scope our research, we will be focusing on the major dengue outbreak that has happened in 2015.
| Data Sources |
| Data | Source | Remarks |
|---|---|---|
| Taiwan Main Island (level I administrative boundaries) | data.gov.tw | Municipality, county and city level I administrative boundaries of the main Taiwan island retrieved from the Ministry of Interior Land Surveying and Mapping Center. |
| Taiwan Boundaries (level III administrative boundaries) | Map Store | Municipality, county and city level III administrative boundaries of the greater Taiwan region retrieved from the National Land Surveying and Mapping Center (Ministry of the Interior) |
| Taiwan's Daily confirmed dengue cases | Data Portal | Dengue daily confirmed cases since 1998 retrieved from the Taiwan CDC (Centers for Disease Control) |
| Data preparation |
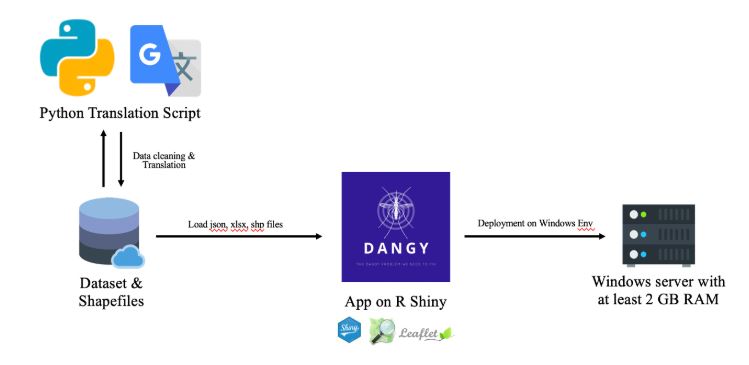
Data extracted directly from the various sources is mostly in CSV and GEOJSON format. One key challenge to data manipulation was the translation of chinese characters and also its accuracy.
Translation of Chinese Characters
We took the initial step to translate the JSON files directly with Google Translate. However, we found that this would alter the original structure of GEOJSON where there was missing parenthesis. Hence we took an alternative approach of using existing python library such as googletrans. Unfortunately, we encountered limitations such as character limit of 15,000.
We finalised with a safer approach using writing our own python script. We utilised selenium module to automate the process of inputting raw content directly into google translation engine and outputting them into proper JSON or CSV data structures.
Accuracy of Translation
Google translation engine does not offer translation for every word in our JSON data files. Our teams encounter a few words without translation after running the script. Hence manual translation is necessary.
Taiwan geographical data we sourced have slightly different county namings from the google translations we received. For example, Google Translation offers translation of “Taipei City” while Taiwan geographical data contains only “Taipei”. Hence further data transformation is required to standardise the county namings. Our team creates a dictionary to store words which involve translation discrepancies and replace the word using vlookup in Excel.
| Academic References |
I.“Spatio-temporal patterns of dengue fever cases in Kaoshiung City, Taiwan, 2003-2008”
The literature was conducted in 2012 driven by the observation of how dengue has been a serious vector-borne disease with a worldwide incidence and was considered to be a pandemic disease. The study takes place in Kaoshiung City, Taiwan between 2003-2008. The geocoded dengue cases was analysed using geospatial analysis to understand the spatio-temporal patterns through hot spot/cold spot analysis and geographically weighted regression models over time space. The study has concluded that to some degree, cases were correlated to its population density, transportation arteries, and water bodies.
II. “stpp: Plotting, Simulating and Analyzing Spatio-Temporal Point Patterns”
Some spatial processes of scientific interest has a temporal aspect that may be accounted when modelling the case such as the distribution of cases for diseases or assessing risks of air pollution. As such, spatio-temporal point processes has to be weighted in, rather than purely spatial point processes. In the journal, the authors conducted an analysis on the first-order properties which describes intensity of the process:
where ds defines a sliced region around study area (s) and dt as a interval time in an overall time in data (t). Thus, informally, λ(s,t) is the mean number of events per unit volume at the location (s,t) which will be applied in understanding the dengue case transmission in this research. The second-order process applies the covariance density, radial distribution function/point-pair correlation function to derive a standardised probability density y that an event occurs in each of two small volumes centred on 2 spatial points (si,ti) and (sj,tj).
| Overview System Architecture Diagram |
| Project Prototype |
| Application Overview |
| 1. Exploratory Data Analysis (EDA) |
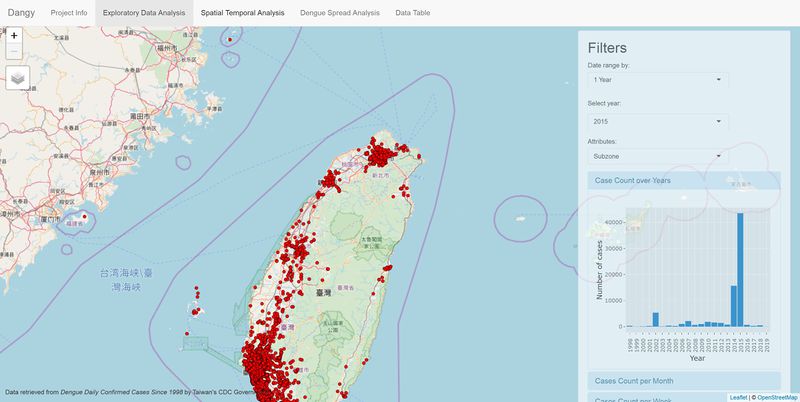
The Exploratory Data Analysis (EDA) section plots a macro level of dengue data cases through points projected on top of Taiwan’s OpenStreetMap layer. Each data points includes attributes such as onset date, case study date, gender, age group, living county, living townshi, residential village, infected countries and cities, infected village, and etc.
Macro level data points overview through EDA gives a short view of particularly in which area most events happened. EDA enables user to draw general conclusion or hypothesis by providing the ability to slice all data points by yearly, 12 weeks date range, and lastly 14 days date range that represents approximately the amount of days needed to identify dengue fever.
Additionally, EDA provides function such as case count over years, case count over month, cases count per week, and lastly distribution of attributes such as age, gender and subzone dependent on the selected date filter. Case counts by year/month will be aggregated independent to the selected time interval.
| 2. Kernel Density Estimation Animation |
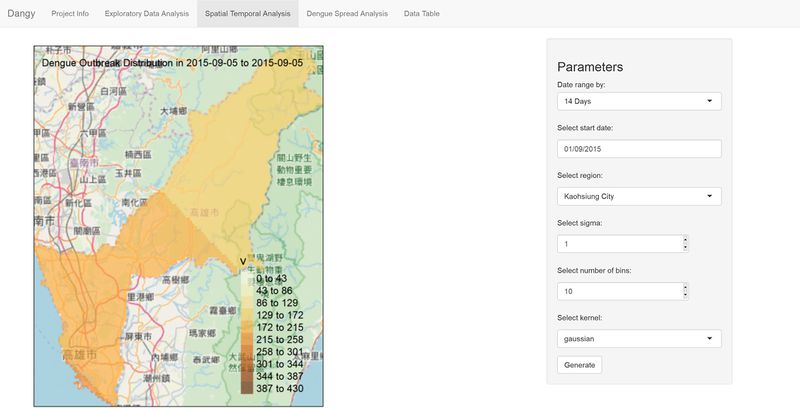
The spatial temporal analysis gives users the ability to animate the dengue outbreak distribution according to date range with parameters such as regions, density’s sigma, number of bins, and kernel function. Moreover, the spatial temporal kernel density enables user to analyse in a local administrator counties available to understand trends from the kernel smoothed intensity.
| 3. Dengue Spread Analysis |
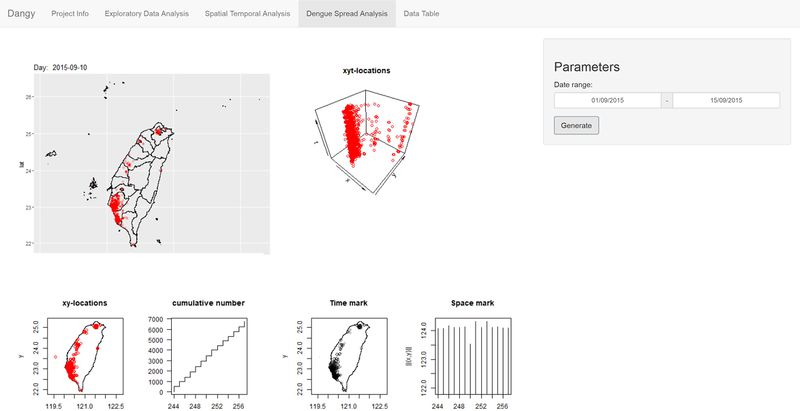
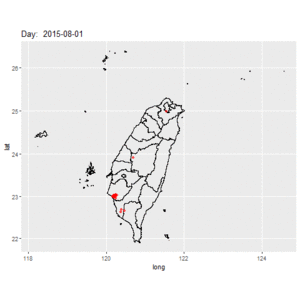
Understanding trends from the kernel density estimation gives the ability to view the intensity according to indicated bandwidth of a point. However, in the light of understanding the how the dengue case spreads require spatio-temporal dimension to be accounted for. The dengue spread analysis function provides user the possibility to simulate dengue case appearance through the selected time range. The possibility is also completed by the x-y-t spatio-temporal, cumulative number and space-mark graphical representation.
The ability to show how geocoded points were added across time will give a simulation of where it started, how spreads, where and when it stopped spreading. Here there are even more possible statistical studies to be conducted as we recognise and gather revelations from the spatio-temporal data and thus giving the ability for users to identify general insights and come up with hypothesis.
| 4. Datatable |
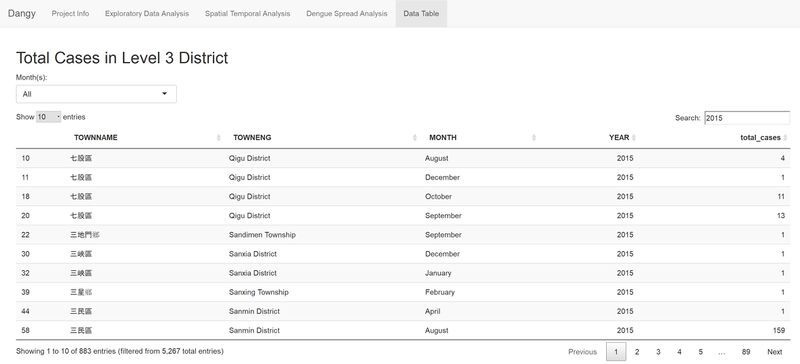
The datasets provided by the Taiwan Centers for Disease Control (CDC) includes the possible infected country, counties and infected village for each dengue cases. This opens up the possibility to draw correlation in which and where the dengue cases were infected from. The aggregated datatable function is complete with search, filtering, and sorting capability to give users the freedom to explore. However in this case, there is a possibility that the infected subject of dengue case was a carrier of Taiwan.
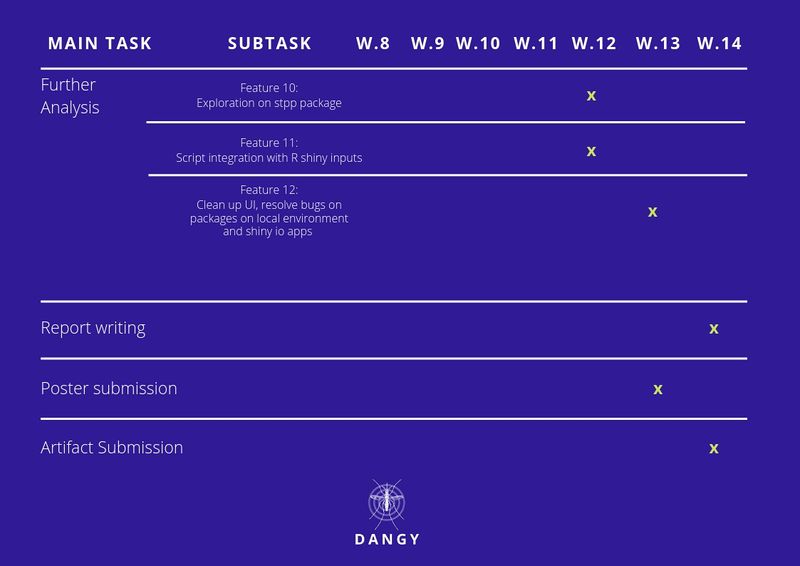
| Project Timeline |
