Difference between revisions of "WhereYouGeo Proposal"
| (20 intermediate revisions by 2 users not shown) | |||
| Line 27: | Line 27: | ||
<div style="background: #14a2d1; padding: 20px; line-height: 0.3em; text-indent: 16px;letter-spacing:0.1em;font-size:26px"><font color=#fbfcfd face="Bebas Neue">PROJECT DESCRIPTION</font></div> | <div style="background: #14a2d1; padding: 20px; line-height: 0.3em; text-indent: 16px;letter-spacing:0.1em;font-size:26px"><font color=#fbfcfd face="Bebas Neue">PROJECT DESCRIPTION</font></div> | ||
| − | + | Singapore’s Public Transport System is the main mode of commuting around in Singapore. This project aims to examine the travelling patterns of commuters for both bus and train in February 2019. In particular, the influx and outflux from different areas (planning area/subzones); with the flexibility of choosing the type of day and timing. Furthermore, the team will employ spatial statistics to evaluate the probability of commuters travelling to a particular train station and to determine the dominant flow of commuters by bus. The application will be developed with R Shiny and Leaflet, allowing the use of interactive map and handling of large data sets. Data used in the application are gathered from sources like LTA DataMall, Singstat, Data.gov and OneMap. Insights gathered after the project has been completed were that most populated train stations during peak period were due to it being near an interchange with great transport accessibility or one area that is populated with office buildings. For bus, we inferred that most commuters congregate in bus stops reflecting dominant flows and great level of accessibility (e.g. Interchange), commuters usually also tend to travel shorter trips with bus as their mode of transport. The findings will be of great importance to government sectors, service providers and relevant geospatial industries. However, given its limitations, more research can be done to minimise generalisability by using specific transport concession data (e.g. students, senior citizens) to extract out more focused insights. | |
| − | |||
| − | |||
<!-- END OF PROJECT DESC---> | <!-- END OF PROJECT DESC---> | ||
| Line 35: | Line 33: | ||
<div style="background: #14a2d1; padding: 20px; line-height: 0.3em; text-indent: 16px;letter-spacing:0.1em;font-size:26px"><font color=#fbfcfd face="Bebas Neue">PROJECT OBJECTIVE</font></div> | <div style="background: #14a2d1; padding: 20px; line-height: 0.3em; text-indent: 16px;letter-spacing:0.1em;font-size:26px"><font color=#fbfcfd face="Bebas Neue">PROJECT OBJECTIVE</font></div> | ||
| − | + | With the application, it can effectively identify the commuters’ key travelling patterns during various periods of the day, especially during the peak period. Furthermore, we will be able to identify the various hotspots and populated areas where commuters cluster in. Our primary analysis is to conduct spatial statistics to identify the probability of commuters visiting a particular MRT station and dominant flow of passenger commuting by Bus. Ultimately, it enables relevant sectors to better plan and allow for efficient decision making that will impact Singaporeans in the future. We will demonstrate the above mentioned with the usage of R Shiny application to explore and analyse large data sets involving both bus and train. | |
<!-- END OF PROJECT OBJECTIVE---> | <!-- END OF PROJECT OBJECTIVE---> | ||
| − | <div style="background: #14a2d1; padding: 20px; line-height: 0.3em; text-indent: 16px;letter-spacing:0.1em;font-size:26px"><font color=#fbfcfd face="Bebas Neue">PROJECT | + | <div style="background: #14a2d1; padding: 20px; line-height: 0.3em; text-indent: 16px;letter-spacing:0.1em;font-size:26px"><font color=#fbfcfd face="Bebas Neue">PROJECT STORYBOARD</font></div> |
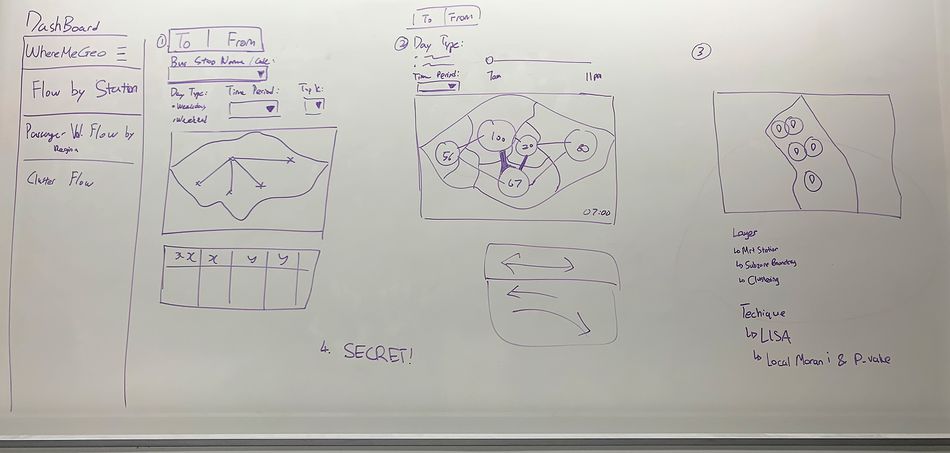
| − | + | [[File:WMG_Storyboard1.JPG|center|950px]] | |
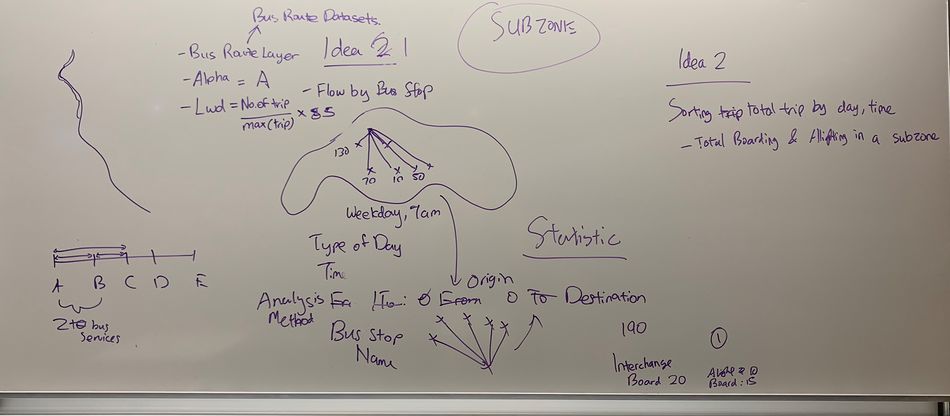
| − | + | [[File:WMG_Storyboard2.JPG|center|950px]] | |
| − | <!-- END OF PROJECT | + | <!-- END OF PROJECT STORYBOARD---> |
<div style="background: #14a2d1; padding: 20px; line-height: 0.3em; text-indent: 16px;letter-spacing:0.1em;font-size:26px"><font color=#fbfcfd face="Bebas Neue">DATA SOURCES</font></div> | <div style="background: #14a2d1; padding: 20px; line-height: 0.3em; text-indent: 16px;letter-spacing:0.1em;font-size:26px"><font color=#fbfcfd face="Bebas Neue">DATA SOURCES</font></div> | ||
| Line 48: | Line 46: | ||
|- | |- | ||
| | | | ||
| − | <b> | + | <b>Data Set</b> |
|| | || | ||
<b>Format</b> | <b>Format</b> | ||
| + | || | ||
| + | <b>Data Attributes</b> | ||
|| | || | ||
<b>Link</b> | <b>Link</b> | ||
| Line 58: | Line 58: | ||
|| | || | ||
CSV | CSV | ||
| + | || | ||
| + | Retrieving in Progress... | ||
|| | || | ||
Data from LTA | Data from LTA | ||
|- | |- | ||
| | | | ||
| − | Bus Stop | + | Bus Stops |
| + | || | ||
| + | SHP | ||
| + | || | ||
| + | * BUS_STOP_N (Bus Stop Number) | ||
| + | * BUS_ROOF_N (Bus Stop Roof Number) | ||
| + | * LOC_DESC (Location Description) | ||
| + | * GEOMETRY (WGS84 Coordinates) | ||
| + | || | ||
| + | [https://www.mytransport.sg/content/mytransport/home/dataMall/search_datasets.html?searchText=bus%20stop LTA DataMall] | ||
| + | |- | ||
| + | | | ||
| + | Passenger Volume by Bus Stops (Alternative Dataset) | ||
| + | || | ||
| + | CSV | ||
| + | || | ||
| + | * YEAR_MONTH (Year and Month of observation: yyyy-mm) | ||
| + | * DAY_TYPE (Day type of observation: WEEKDAY / WEEKENDS/HOLIDAY) | ||
| + | * TIME_PER_HOUR (Time of the day in hour) | ||
| + | * PT_TYPE (Public Transport Type: BUS) | ||
| + | * ORIGIN_PT_CODE (Origin Bus Stop Code) | ||
| + | * DESTINATION_PT_CODE (Destination Bus Stop Code) | ||
| + | * TOTAL_TRIP (Total amount of passengers who tap in from origin bus stop and tap out from destination bus stop) | ||
| + | || | ||
| + | LTA DataMall Dynamic Datasets | ||
| + | |- | ||
| + | | | ||
| + | Passenger Volume by Origin Destination Bus Stops (Alternative Dataset) | ||
| + | || | ||
| + | CSV | ||
| + | || | ||
| + | * YEAR_MONTH (Year and Month of observation: yyyy-mm) | ||
| + | * DAY_TYPE (Day type of observation: WEEKDAY / WEEKENDS/HOLIDAY) | ||
| + | * TIME_PER_HOUR (Time of the day in hour) | ||
| + | * PT_TYPE (Public Transport Type: BUS) | ||
| + | * PT_CODE (Bus Stop Code) | ||
| + | * TOTAL_TAP_IN_VOLUME (Number of passenger that tap in at a given bus stop) | ||
| + | * TOTAL_TAP_OUT_VOLUME (Number of passenger that tap out at a given bus stop | ||
| + | || | ||
| + | LTA DataMall Dynamic Datasets | ||
| + | |- | ||
| + | | | ||
| + | Train Stations | ||
|| | || | ||
| − | + | SHP | |
|| | || | ||
| − | LTA | + | * OBJECTID (Index) |
| + | * STN_NAME (Station Name) | ||
| + | * STN_NO (Station Number) | ||
| + | * GEOMETRY (WGS84 Coordinates) | ||
| + | || | ||
| + | [https://www.mytransport.sg/content/mytransport/home/dataMall/search_datasets.html?searchText=mrt LTA DataMall] | ||
|- | |- | ||
| | | | ||
| − | + | Passenger Volume by Origin Destination Train Stations (Alternative Dataset) | |
| + | || | ||
| + | CSV | ||
| + | || | ||
| + | * YEAR_MONTH (Year and Month of observation: yyyy-mm) | ||
| + | * DAY_TYPE (Day type of observation: WEEKDAY / WEEKENDS/HOLIDAY) | ||
| + | * TIME_PER_HOUR (Time of the day in hour) | ||
| + | * PT_TYPE (Public Transport Type: TRAIN) | ||
| + | * ORIGIN_PT_CODE (Origin Train Station Code) | ||
| + | * DESTINATION_PT_CODE (Destination Train Station Code) | ||
| + | * TOTAL_TRIP (Total amount of passengers who tap in from origin train station and tap out from destination train station) | ||
| + | || | ||
| + | LTA DataMall Dynamic Datasets | ||
| + | |- | ||
| + | | | ||
| + | Passenger Volume by Train Stations (Alternative Dataset) | ||
| + | || | ||
| + | CSV | ||
|| | || | ||
| − | + | * YEAR_MONTH (Year and Month of observation: yyyy-mm) | |
| + | * DAY_TYPE (Day type of observation: WEEKDAY / WEEKENDS/HOLIDAY) | ||
| + | * TIME_PER_HOUR (Time of the day in hour) | ||
| + | * PT_TYPE (Public Transport Type: TRAIN) | ||
| + | * PT_CODE (Train Station Code) | ||
| + | * TOTAL_TAP_IN_VOLUME (Number of passenger that tap in at a given mrt station) | ||
| + | * TOTAL_TAP_OUT_VOLUME (Number of passenger that tap out at a given mrt station) | ||
|| | || | ||
| − | LTA | + | LTA DataMall Dynamic Datasets |
|- | |- | ||
|} | |} | ||
| + | <b> As API Key is required and constraint in time per each request of data (5 mins), our team is unable to provide the link for datasets from "LTA DataMall Dynamic Datasets". </b> | ||
</div> | </div> | ||
<!-- END OF DATA SOURCES---> | <!-- END OF DATA SOURCES---> | ||
| + | |||
| + | <div style="background: #14a2d1; padding: 20px; line-height: 0.3em; text-indent: 16px;letter-spacing:0.1em;font-size:26px"><font color=#fbfcfd face="Bebas Neue">PROJECT TIMELINE</font></div> | ||
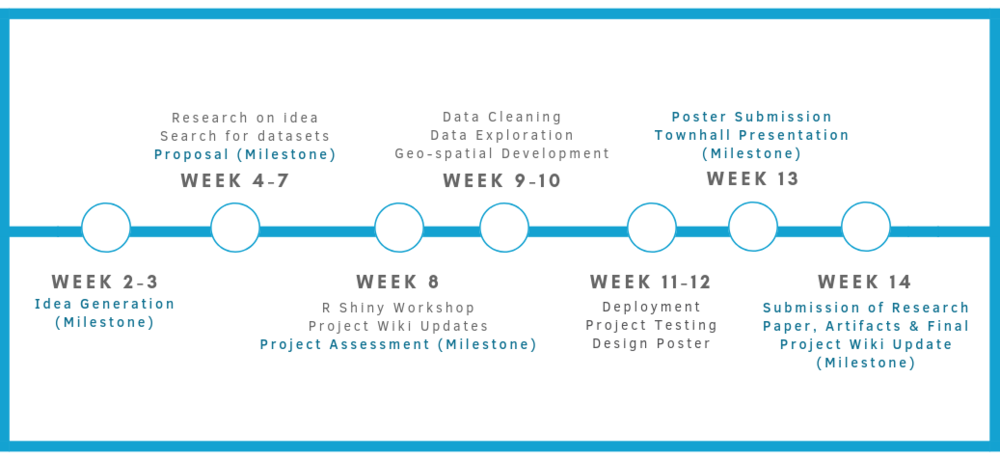
| + | [[File:WhereYouGeoSchedule.png|center|1000px]] | ||
| + | <!-- END OF PROJECT TIMELINE---> | ||
<div style="background: #14a2d1; padding: 20px; line-height: 0.3em; text-indent: 16px;letter-spacing:0.1em;font-size:26px"><font color=#fbfcfd face="Bebas Neue">PROJECT KEY CHALLENGES</font></div> | <div style="background: #14a2d1; padding: 20px; line-height: 0.3em; text-indent: 16px;letter-spacing:0.1em;font-size:26px"><font color=#fbfcfd face="Bebas Neue">PROJECT KEY CHALLENGES</font></div> | ||
| Line 95: | Line 172: | ||
| | | | ||
1. | 1. | ||
| + | || | ||
| + | Not familiar with spatial analysis method and its related R packages | ||
| + | || | ||
| + | As the team is new to geospatial, there are certain concept that the team is not knowledgeable in. <br> | ||
| + | In addition, the team is not well verse with R programming language. <br> | ||
| + | || | ||
| + | Do more self-learning via online research or datacamp <br> | ||
| + | Look through online resources like R documentation <br> | ||
| + | Look through hands on exercise to help us gain more knowledge in both theory and R language | ||
|| | || | ||
Fill me in | Fill me in | ||
| + | |- | ||
| + | | | ||
| + | 2. | ||
| + | || | ||
| + | Lack of data for analysis | ||
|| | || | ||
| − | + | As Singapore does not collect much data on human traffic flow, this might be a potential challenge for the team to conduct spatial analysis. | |
|| | || | ||
| − | + | Look for relevant agencies or find different data sets to merge and conduct spatial analysis. | |
|| | || | ||
Fill me in | Fill me in | ||
| Line 125: | Line 216: | ||
1. | 1. | ||
|| | || | ||
| − | + | GIS Lounge | |
| + | || | ||
| + | [https://www.gislounge.com/overview-flow-mapping/ Overview of Flow Mapping] | ||
| + | |- | ||
| + | | | ||
| + | 2. | ||
| + | || | ||
| + | YouTube (This project is part of "Open Data Challenge for Public Transport in Tokyo 2017".) | ||
| + | || | ||
| + | [https://www.youtube.com/watch?v=qAxHFK64kbM Heavy 4D Tokyo] <br> | ||
| + | [https://tokyochallenge.odpt.org/2017/award/index-e.html Winning projects for the "Open Data Challenge for Public Transport in Tokyo 2017".] (Translation may be required as web-page is in Japanese) | ||
| + | |- | ||
| + | | | ||
| + | 3. | ||
| + | || | ||
| + | Anita Graser | ||
|| | || | ||
| − | + | [https://anitagraser.com/2017/10/08/movement-data-in-gis-8-edge-bundling-for-flow-maps/ Movement data in GIS #8: edge bundling for flow maps] | |
|- | |- | ||
|} | |} | ||
Latest revision as of 15:00, 14 April 2019
Singapore’s Public Transport System is the main mode of commuting around in Singapore. This project aims to examine the travelling patterns of commuters for both bus and train in February 2019. In particular, the influx and outflux from different areas (planning area/subzones); with the flexibility of choosing the type of day and timing. Furthermore, the team will employ spatial statistics to evaluate the probability of commuters travelling to a particular train station and to determine the dominant flow of commuters by bus. The application will be developed with R Shiny and Leaflet, allowing the use of interactive map and handling of large data sets. Data used in the application are gathered from sources like LTA DataMall, Singstat, Data.gov and OneMap. Insights gathered after the project has been completed were that most populated train stations during peak period were due to it being near an interchange with great transport accessibility or one area that is populated with office buildings. For bus, we inferred that most commuters congregate in bus stops reflecting dominant flows and great level of accessibility (e.g. Interchange), commuters usually also tend to travel shorter trips with bus as their mode of transport. The findings will be of great importance to government sectors, service providers and relevant geospatial industries. However, given its limitations, more research can be done to minimise generalisability by using specific transport concession data (e.g. students, senior citizens) to extract out more focused insights.
With the application, it can effectively identify the commuters’ key travelling patterns during various periods of the day, especially during the peak period. Furthermore, we will be able to identify the various hotspots and populated areas where commuters cluster in. Our primary analysis is to conduct spatial statistics to identify the probability of commuters visiting a particular MRT station and dominant flow of passenger commuting by Bus. Ultimately, it enables relevant sectors to better plan and allow for efficient decision making that will impact Singaporeans in the future. We will demonstrate the above mentioned with the usage of R Shiny application to explore and analyse large data sets involving both bus and train.
|
Data Set |
Format |
Data Attributes |
Link |
|
LTA Concession Data |
CSV |
Retrieving in Progress... |
Data from LTA |
|
Bus Stops |
SHP |
|
|
|
Passenger Volume by Bus Stops (Alternative Dataset) |
CSV |
|
LTA DataMall Dynamic Datasets |
|
Passenger Volume by Origin Destination Bus Stops (Alternative Dataset) |
CSV |
|
LTA DataMall Dynamic Datasets |
|
Train Stations |
SHP |
|
|
|
Passenger Volume by Origin Destination Train Stations (Alternative Dataset) |
CSV |
|
LTA DataMall Dynamic Datasets |
|
Passenger Volume by Train Stations (Alternative Dataset) |
CSV |
|
LTA DataMall Dynamic Datasets |
As API Key is required and constraint in time per each request of data (5 mins), our team is unable to provide the link for datasets from "LTA DataMall Dynamic Datasets".
|
No. |
Key Technical Challenges |
Description |
Proposed Solution |
Outcome |
|
1. |
Not familiar with spatial analysis method and its related R packages |
As the team is new to geospatial, there are certain concept that the team is not knowledgeable in. |
Do more self-learning via online research or datacamp |
Fill me in |
|
2. |
Lack of data for analysis |
As Singapore does not collect much data on human traffic flow, this might be a potential challenge for the team to conduct spatial analysis. |
Look for relevant agencies or find different data sets to merge and conduct spatial analysis. |
Fill me in |
|
No. |
Website Name |
Link |
|
1. |
GIS Lounge |
|
|
2. |
YouTube (This project is part of "Open Data Challenge for Public Transport in Tokyo 2017".) |
Heavy 4D Tokyo |
|
3. |
Anita Graser |
|
No. |
Name |
Date |
Comments |
|
1. |
Insert your Name here |
Insert Date here |
Insert Comment here |
|
2. |
Insert your Name here |
Insert Date here |
Insert Comment here |
|
3. |
Insert your Name here |
Insert Date here |
Insert Comment here |


