Difference between revisions of "NeighbourhoodWatchDocs Proposal"
| Line 241: | Line 241: | ||
Total Number of Clinics in Singapore | Total Number of Clinics in Singapore | ||
|| | || | ||
| − | + | Filtering out any TCM Clinics | |
|- | |- | ||
Revision as of 21:27, 10 March 2019
With the improved analysis on the distribution match up, we will be able to better understand the impact of current and future healthcare policies, with GP being the first line of healthcare provided for the elderly, and better supporting decision making.
- To build a GIS tool (an R Shiny app)
- Analyse the demand and supply of clinics using the proximity of each clinic in residential zones
- Evaluate results of analysis and provide recommendations to further improve the social welfare for the residents who require special assistance
|
No. |
Dataset |
Description |
Source(s) |
|
1. |
OSM Layer (Singapore) |
This dataset is necessary for us to be able to plot the Singapore map. |
OpenStreetMap |
|
2. |
Singapore Planning Subzone (MP14_SUBZONE_WEB_PL) |
This dataset is necessary for us to be able to plot the Singapore map out at a planning subzone level. |
https://data.gov.sg/dataset/master-plan-2014-subzone-boundary-no-sea |
|
3. |
Estimated Singapore Resident Population in HDB Flats |
Find out the number of residents per estate. |
https://data.gov.sg/dataset/estimated-resident-population-living-in-hdb-flats |
|
4. |
Dwelling Units under HDB's Management, by Town and Flat Type |
Shows number of units per estate for each flat type. |
https://data.gov.sg/dataset/number-of-residential-units-under-hdb-s-management |
|
5. |
Residents by Age Group & Type of Dwelling, Annual |
Shows age group and number of residents by type of dwelling. |
https://data.gov.sg/dataset/residents-by-age-group-type-of-dwelling-annual |
|
6. |
Singapore Residents by Subzone and Type of Dwelling, June 2017 |
This dataset is necessary for us to find out the total number of elderly population in a specific Subzone. |
https://data.gov.sg/dataset/singapore-residents-by-subzone-and-type-of-dwelling-jun-2017 |
|
7. |
Singapore Residents by Subzone, Age Group and Sex, June 2017 (Gender) |
This dataset is necessary for us to find out the total number of elderly population. |
https://data.gov.sg/dataset/singapore-residents-by-subzone-age-group-and-sex-jun-2017-gender |
|
8. |
Total Number of Clinics in Singapore |
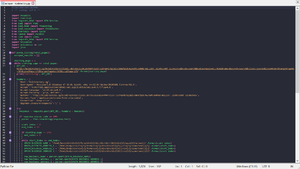
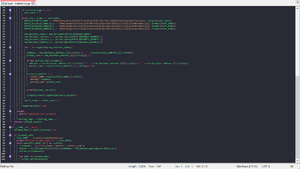
This dataset is necessary for us to locate all the neighborhood clinics in Singapore and find out their respective addresses, so as to aid in our proximity analysis with the dwellings. As this data is not readily available to us, we will need to perform web scraping to "scrape" the data off the Singapore Healthcare Institutions Directory (HCI) website. A Python script can help us achieve the following and more details can be found below. |
|
|
9. |
Total Number of TCM Clinics in Singapore |
This dataset is necessary for us to locate all the TCM Medical Centres in Singapore and find out their respective addresses, so as to aid in our proximity analysis with the dwellings. As this data is not readily available to us, we will need to perform web scraping to "scrape" the data off the Singapore Traditional Chinese Medicine Practitioners Board (TCM Board) website. Code tweaks to the Python script used for the HCI website data will help us collect this dataset successfully. |
https://prs.moh.gov.sg/prs/internet/profSearch/main.action?hpe=TCM |
| Code Snippet 1 | Code Snippet 2 |
|---|---|
1. Uses a set of pre-defined parameters and settings to visit through each page of the HCI's search results in a loop.
2. Make use of XPATH expressions to retrieve the content (healthcare facility name, address, postal code) located at specific HTML attributes.
3. When all pages are visited, the retrieved information will be parsed and stored into a .CSV file with the respective columns.
To perform the assess if existing healthcare amenities or elderly care amenities are meeting the needs of Singaporeans age above 65 living in public housing provided by the Housing & Development Board (HDB), we would require 3 sets of data:
1.Data on supply, as defined by the location of GP clinics.
2.Data on demand, as defined by census data, that could give us an understanding of the number of potential beneficiaries of GP services, living in public housing.
3.Data on the location of the source of demand,which we would define as the location of public housing flats, where beneficiaries live.
|
No. |
Dataset |
Data to filter |
|
1. |
OSM Layer (Singapore) |
- |
|
2. |
Singapore Planning Subzone (MP14_SUBZONE_WEB_PL) |
- |
|
3. |
Estimated Singapore Resident Population in HDB Flats |
Financial Year 2017 |
|
4. |
Dwelling Units under HDB's Management, by Town and Flat Type |
Financial Year 2017 |
|
5. |
Residents by Age Group & Type of Dwelling, Annual |
Financial Year 2017 and Age Group >= 65 |
|
6. |
Singapore Residents by Subzone and Type of Dwelling, June 2017 |
- |
|
7. |
Singapore Residents by Subzone, Age Group and Sex, June 2017 (Gender) |
- |
|
8. |
Total Number of Clinics in Singapore |
Filtering out any TCM Clinics |
|
9. |
Total Number of TCM Clinics in Singapore |
- |
Use GIS techniques to narrow down scope of where to build potential clinics
Pattern Visualization
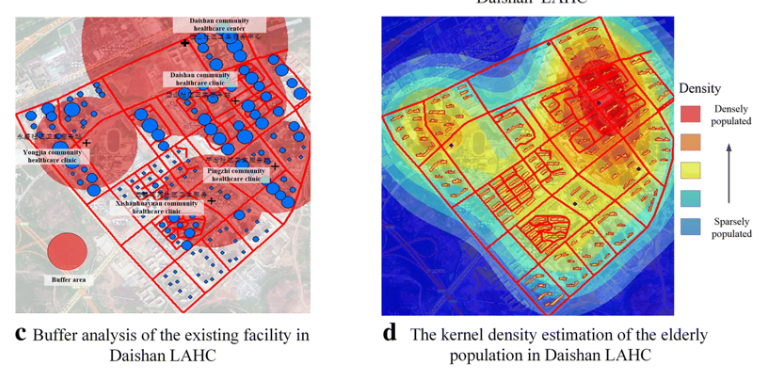
Buffer Analysis
Kernel Density Estimation
The Monte Carlo Simulation method is often use to test the distribution pattern of point events, and whether these points are uniformly and independently distributed over a network depends on the differences between the K-function values and the completely spatial random (CSR) point pattern test. If K(l) is above the upper CSR bound, the point set P is in a cluster distribution. If K(l) is below the lower CSR bound, the point set P is in a dispersion distribution. KDE should look at 100 – 300m bandwidth for study of urban economic activities.
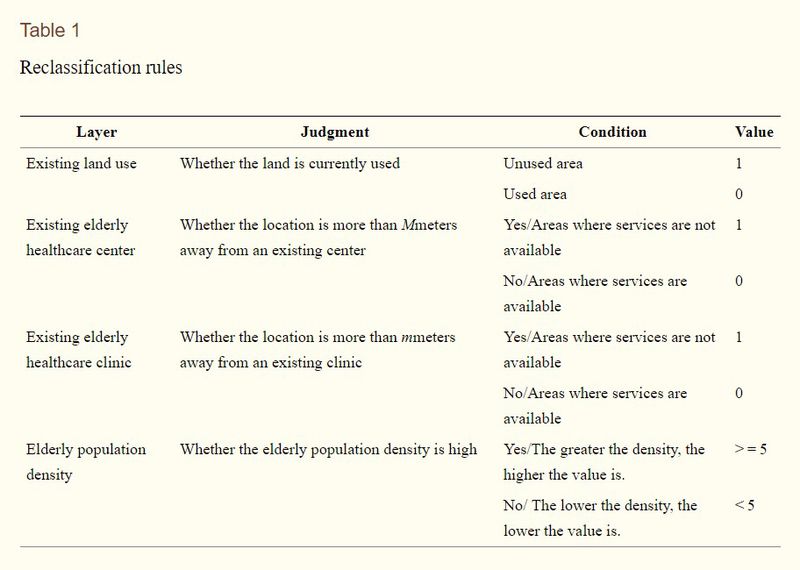
Overlay analysis
Then use grid analysis to identify candidate locations for clinics.
Based on reclassification, the greater the value obtained from the calculated results, the higher the suitability of the area as a candidate. Final calculated values greater than 0 indicate that the candidate points meet the above requirements.
Location allocation model
P-median model
Backup Coverage model
Refernces
Challenges and Solutions for Location of Healthcare Facilities. (2019). Omicsonline.org. Retrieved 10 March 2019, from https://www.omicsonline.org/open-access/challenges-and-solutions-for-location-of-healthcare-facilities-2169-0316.1000127.pdf
Gu, T., Li, L., & Li, D. (2018). A two-stage spatial allocation model for elderly healthcare facilities in large-scale affordable housing communities: a case study in Nanjing City. International Journal For Equity In Health, 17(1). doi:10.1186/s12939-018-0898-6
Jia, T., Tao, H., Qin, K., Wang, Y., Liu, C., & Gao, Q. (2014). Selecting the optimal healthcare centers with a modified P-median model: a visual analytic perspective. International Journal Of Health Geographics, 13(1), 42. doi:10.1186/1476-072x-13-42
Ni, J., Qian, T., Xi, C., Rui, Y., & Wang, J. (2016). Spatial Distribution Characteristics of Healthcare Facilities in Nanjing: Network Point Pattern Analysis and Correlation Analysis. International Journal Of Environmental Research And Public Health, 13(8), 833. doi:10.3390/ijerph13080833
Polo, G., Acosta, C., Ferreira, F., & Dias, R. (2015). Location-Allocation and Accessibility Models for Improving the Spatial Planning of Public Health Services. PLOS ONE, 10(3), e0119190. doi:10.1371/journal.pone.0119190
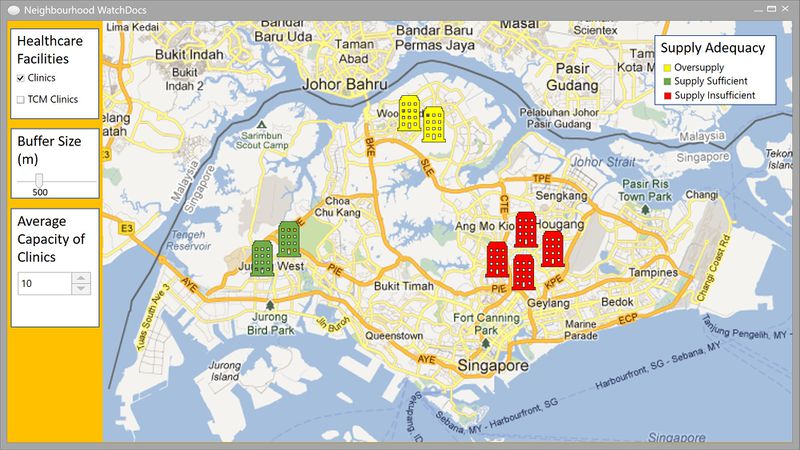
Our team aims to create a dashboard that will display all the clinics (medical and TCM) across Singapore. We will also display dwellings in the respective subzones and the estimated number of elderly aged 65 and above staying there. Just the above will show the supply and demand for healthcare in clinics. Further analysis will be calculated on how the supply and demand are met, as well as to identify any potential gaps e.g. overdemand or oversupply of healthcare facilities in a particular subzone.
The supply and demand data for selected subzones will then be displayed on a data table for better visualization.
These are the tools and technology our team aims to explore and use through the period of the project to achieve our objectives. It will be updated as we go through the project.
|
No. |
Key Technical Challenges |
Description |
Proposed Solution |
Outcome |
|
1. |
Unfamiliarity with R packages and R Shiny |
Our team may encounter the use of additional R resources that were not taught in class. |
- Independent Learning on R packages and R Shiny |
We managed to solve the mentioned challenge with the following resources: |
|
2. |
Data Cleaning and Transformation |
As we need to collect the data from various sources, they may have different attributes such as the Coordinate Reference System (CRS), units of measurement and etc. |
Adopt a standardized process of cleaning the data, focusing with what we only need. Most of the datasets used for our project can be found in our Hands-On or Take-Home exercises and we can rely on those existing data. |
We managed to solve our technical challenge with the following: |
|
3. |
Limitations & Constraints in Datasets |
There are certain assumptions that we need to make based on the context and purpose of our project, such as the average number of doctors in a particular clinic, which cannot be derived from our datasets. |
Working out with the team together and figuring out a reasonable and valid assumption, together with adequate online research and consultation with Prof. Kam. |
We managed to solve our technical challenge with the following: |
