|
|
| Line 83: |
Line 83: |
| | | | |
| | == Approach == | | == Approach == |
| | + | <strong>Techniques</strong> |
| | | | |
| | == Web Application Design == | | == Web Application Design == |
Revision as of 11:28, 4 March 2019
Project Motivation
Climate change is a global environmental issue that impacts everyone, and a key contributor to this issue is the rising energy consumption to meet growing energy need. Singapore has launched campaigns to promote more efficient use of energy to meet this growing energy need rather than increasing energy consumption[1]. In order to better tackle this rising energy consumption, we will first need to understand what are the factors that contribute to this increase, and this was the key motivation that led us to embarking upon this project.
Project Objective
Through our project, we aim to:
- Identify variables that have a strong influence on energy consumption. We plan to examine variables such as location in Singapore, temperature, age, income level and housing types
- Identify geographical clusters of sub-zones with abnormally high/low level of energy consumption in Singapore
- Identify the key difference between regions with high consumption and regions with low consumption
- Create a regression model that is able to predict the energy consumption of a family
Data
| Data |
Source |
Data Type
|
| Average Monthly Household Electricity Consumption by Postal Code (Public Housing) & Dwelling Type, 2H 2016 |
Energy Market Authority (ema.gov.sg) |
xls
|
| Average Monthly Household Electricity Consumption by Postal Code (Public Housing) & Dwelling Type, 1H 2016 |
Energy Market Authority (ema.gov.sg) |
xls
|
| Average Monthly Household Electricity Consumption by Postal Code (Public Housing) & Dwelling Type, 2H 2015 |
Energy Market Authority (ema.gov.sg) |
xls
|
| Average Monthly Household Electricity Consumption by Postal Code (Public Housing) & Dwelling Type, 1H 2015 |
Energy Market Authority (ema.gov.sg) |
xls
|
| Average Monthly Household Electricity Consumption by Postal Code (Public Housing) & Dwelling Type, 2H 2014 |
Energy Market Authority (ema.gov.sg) |
xls
|
| Average Monthly Household Electricity Consumption by Postal Code (Public Housing) & Dwelling Type, 1H 2014 |
Energy Market Authority (ema.gov.sg) |
xls
|
| Average Monthly Household Electricity Consumption by Postal Code (Public Housing) & Dwelling Type, 2H 2013 |
Energy Market Authority (ema.gov.sg) |
xls
|
| Average Monthly Household Electricity Consumption by Postal Code (Public Housing) & Dwelling Type, 1H 2013 |
Energy Market Authority (ema.gov.sg) |
xls
|
| Average Monthly Household Electricity Consumption by Postal Code (Private Apartments), 2015 and 2016 |
Energy Market Authority (ema.gov.sg) |
xls
|
| Average Monthly Household Electricity Consumption by Postal Code (Private Apartments), 2013 to 2014 |
Energy Market Authority (ema.gov.sg) |
xls
|
| Resident Households by Planning Area and Dwelling Type/Household Size/Monthly Household Income |
Department of Statistics Singapore (singstat.gov.sg) |
xls
|
| Singapore Residents by Planning Area/Subzone, Age Group and Sex, June 2000 - 2018 |
Department of Statistics Singapore (singstat.gov.sg) |
csv
|
| Singapore Residents by Planning Area/Subzone and Type of Dwelling, June 2000 - 2018 |
Department of Statistics Singapore (singstat.gov.sg) |
csv
|
| Singapore Climate Historical Data |
Meteorological Service Singapore (weather.gov.sg) |
csv
|
Literature Review
Methodology:
Learning Points:
Areas for improvement:
Approach
Techniques
Web Application Design
Design Inspiration
The dashboard design is inspired by https://stanleyadion.shinyapps.io/AmazeingCrop
Initial Storyboard
|
Design |
Description
|
| 1. |
 |
- Project and Dataset Overview
|
| 2. |
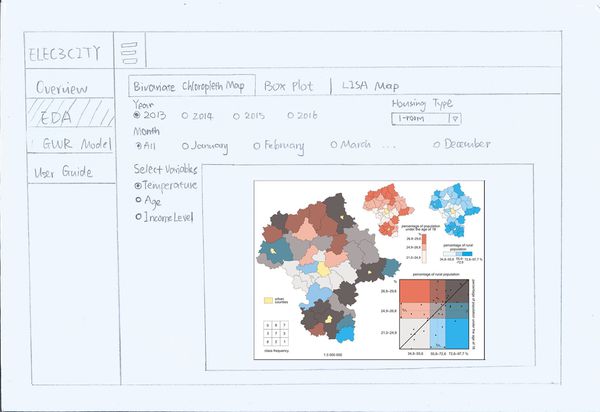 |
- Bivariate Choropleth Maps showing relationships between energy consumption with other factors
- Users can choose the factor they want to compare with energy consumtion
|
| 3. |
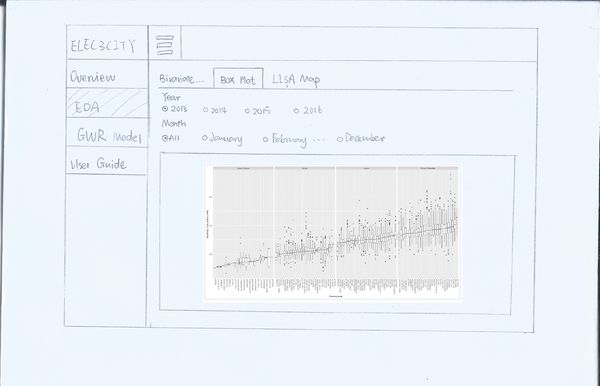 |
- A Box-plot showing distributions of energy consumption by Planning Zone and Dwelling Type
|
| 4. |
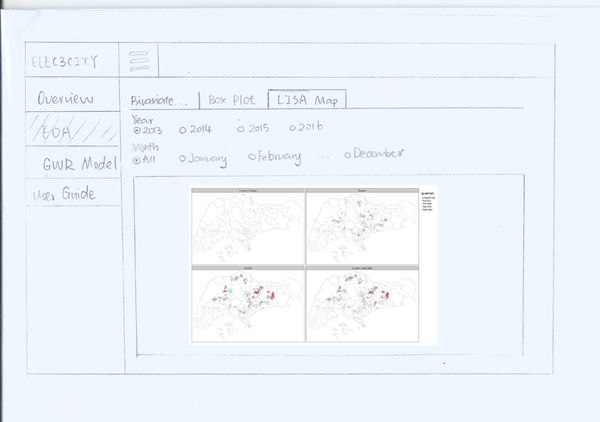 |
- Lisa Maps showing spatial clustering of energy consumption observations
|
| 5. |
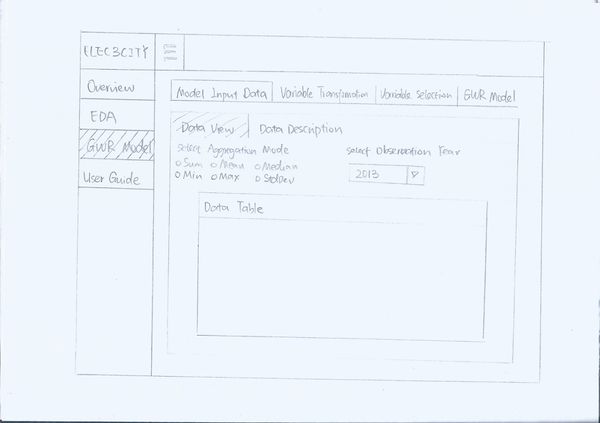 |
- Overview of Data for GWR model
|
| 6. |
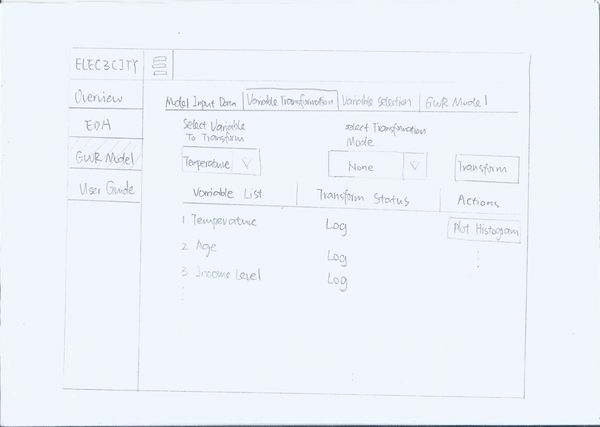 |
- Transform Data for GWR model
|
| 7. |
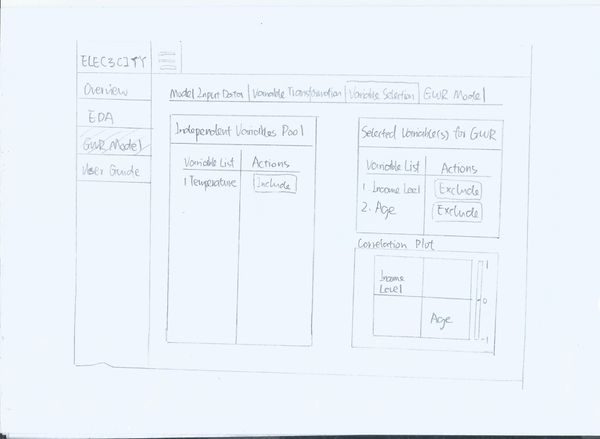 |
- Select Variables for GWR model
|
| 8. |
 |
- Configure a GWR model and view the results
|
Project Challenges
|
Key Challenges |
Description |
Solution
|
| 1. |
Technical Challenge |
The proposed geovisualization including bivariate choropleth maps and box-plots by planning zones and dwelling type is complex. The group may encounter technical challenges such as finding relevant R packages and functions when building the visualization. |
- Research on relevant R tutorials
- Consult Prof Kam
|
| 2. |
|
|
|
| 3. |
|
|
|
Project Timeline
Feel free to leave any comments! :)
|
No.
|
Name
|
Date
|
Comments
|
|
1.
|
Insert your Name here
|
Insert Date here
|
Insert Comment here
|
|
2.
|
Insert your Name here
|
Insert Date here
|
Insert Comment here
|
|
3.
|
Insert your Name here
|
Insert Date here
|
Insert Comment here
|


