ISSS608 2018-19 T1 Assign Huang Shan Methodology&Dashoboard
|
|
|
|
|
|
Data Preparation
It is time to explore the particular datasets. There are four files in the dataset then I will utilize them for different purposes.The datasets and analysis have been prepared using Tableau, JMP, R and Excel.
Official Air Quality Measurements
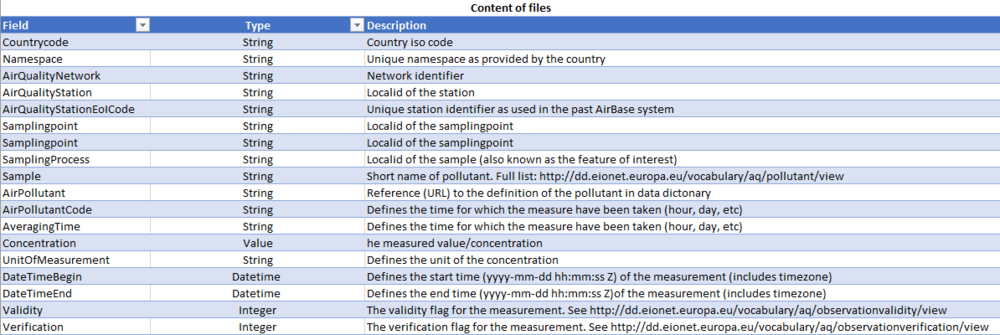
EEA Data made up of 29 excel files and 1 text file. Of 28 excel files with PM10 concentrations values from 2013 to 2018 at the 6 different official air quality stations.I found that not every file is complete from 2013 to 2018. Below the table display the data structure:
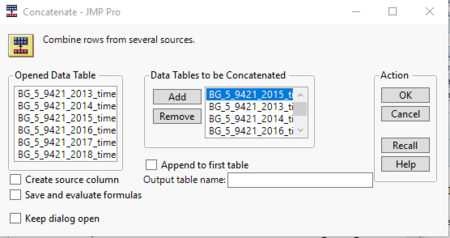
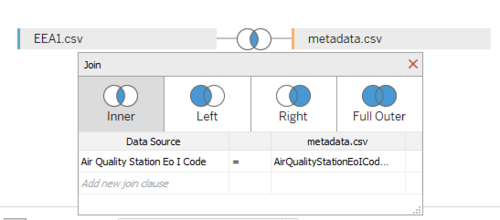
Firstly, I used JMP Pro 13 to combine the data of each AirPollutionStation from 2013 to 2018.This column identifies the name of the source data table in the corresponding rows.Then I continue to use the same method to merge the six data in the previous step into a complete one with JMP. Finally, The combine data file is joined with metadata file by AirQualityEOLStationCode as the link.
Citizen Science Air Quality Measurements
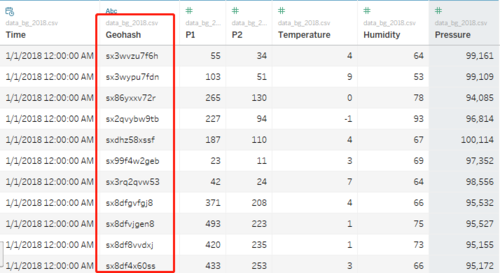
There are two files in this datasets data_bg_2017.csv,data_bg_2018.csv.Here are some sample data in the particular files:
Geohash is a latitude/longitude geocode system (public domain). It is a hierarchical spatial data structure which subdivides space into buckets of grid shape.Geohashes offer properties like arbitrary precision and the possibility of gradually removing characters from the end of the code to reduce its size (and gradually lose precision).As a consequence of the gradual precision degradation, nearby places will often (but not always) present similar prefixes. The longer a shared prefix is, the closer the two places are.
Meteorological measurements & Topography data
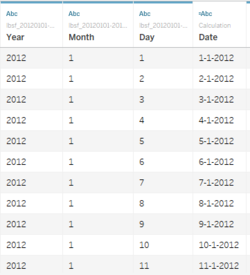
Meteorological measurements (1 station): Temperature; Humidity; Wind speed; Pressure; Rainfall; Visibility, Methodology development for integrating the biophysical impacts of land-use change in life-cycle assessment. Firstly, We used the plus sign(+)operator to combine day/month/year into date for new calculated field.

