ISSS608 2018-19 T1 Assign Huang Shan Methodology&Dashoboard
|
|
|
|
|
|
Data Preparation
It is time to explore the particular datasets. There are four files in the dataset then I will utilize them for different purposes.The datasets and analysis have been prepared using Tableau, JMP, R and Excel.
Official Air Quality Measurements
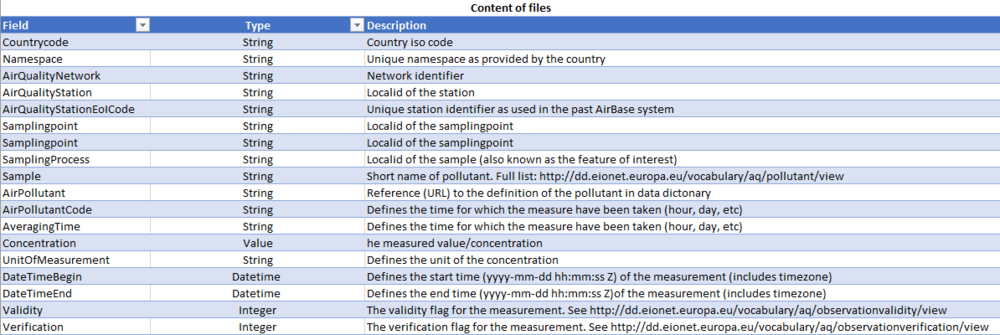
EEA Data made up of 29 excel files and 1 text file. Of 28 excel files with PM10 concentrations values from 2013 to 2018 at the 6 different official air quality stations.I found that not every file is complete from 2013 to 2018. Below the table display the data structure:
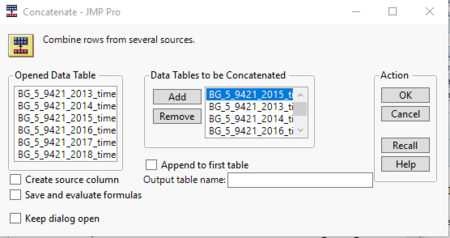
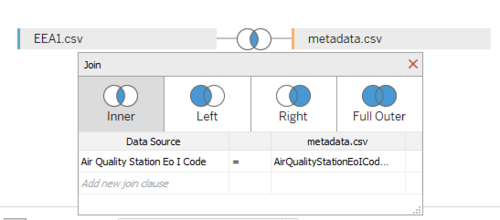
Firstly, I used JMP Pro 13 to combine the data of each AirPollutionStation from 2013 to 2018.This column identifies the name of the source data table in the corresponding rows.Then I continue to use the same method to merge the six data in the previous step into a complete one with JMP. Finally, The combine data file is joined with metadata file by AirQualityEOLStationCode as the link.


