ISSS608 2018-19 T1 Assign Zhang Yanli Task1
|
|
|
|
|
|
|
Task 1: Spatio-temporal Analysis of Official Air Quality
This dataset consists of 28 files from 2013 to 2018 and one metadata file that consists OF the latitude and longitude (using ‘AirQualityStationEoICode’ as a key to inner join all separately data file). There are 6 official air quality stations in Sofia including Druzhba, Hipodrum, IAOS/Pavlovo, Mladost, Nadezhda and Orlov Most. The six stations divided into two station types which are background and traffic.
View the interactive Tableau design here: link
| Patterns | Visualization |
|---|---|
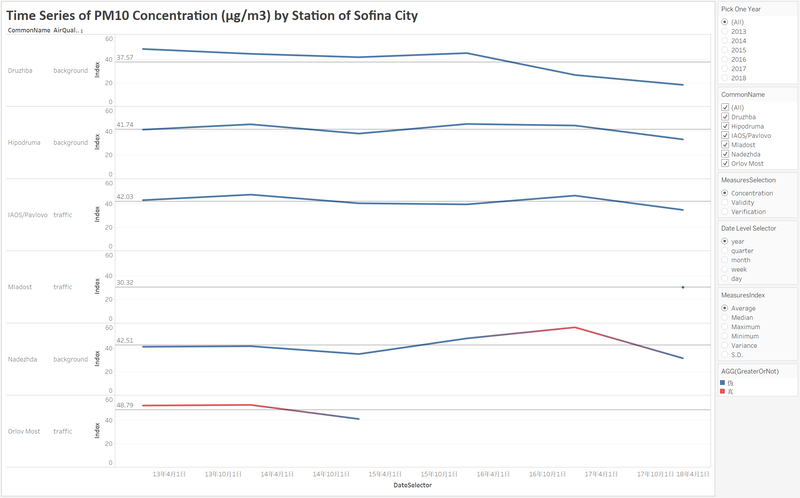
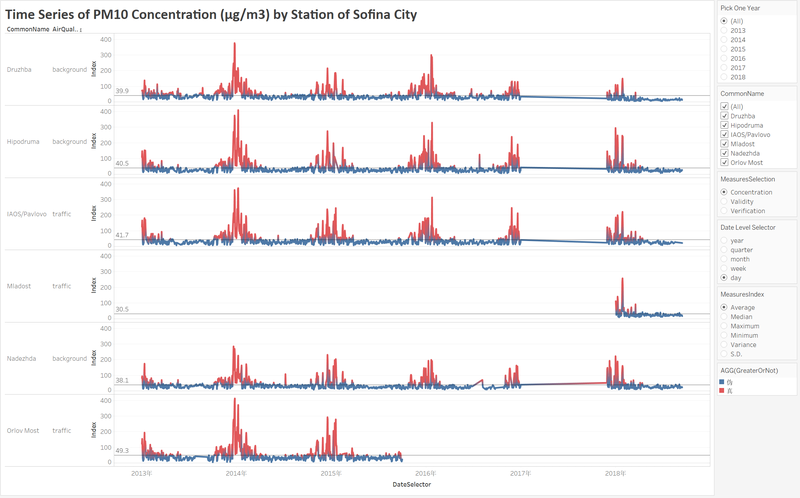
| The air quality of Sofia city picks up gradually in most recent years. As can be seen from the diagram, great changes of average concentration have taken place during 2017 and 2018 from 43.96 to 29.52 . More specially, the average concentration in six stations also declines. From the diagram above, it is easy to see that there are missing data in Mladost and Orlov Most stations. For Orlov Most station, the official air quality dataset only consists of the data from 2013 to 2015. While, the dataset only consists of the data of 2018 for Mladost station. When we do the analysis, there would be some errors may occur.
|
|
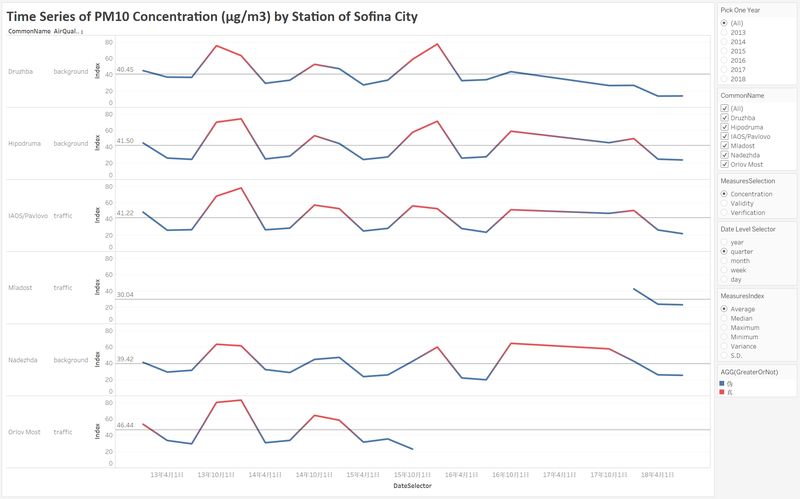
| In the second quarter and third quarter of each year, the average concentration is lower than overall concentration. In the fourth quarter, the average concentration reaches peak during the whole year.
|
|
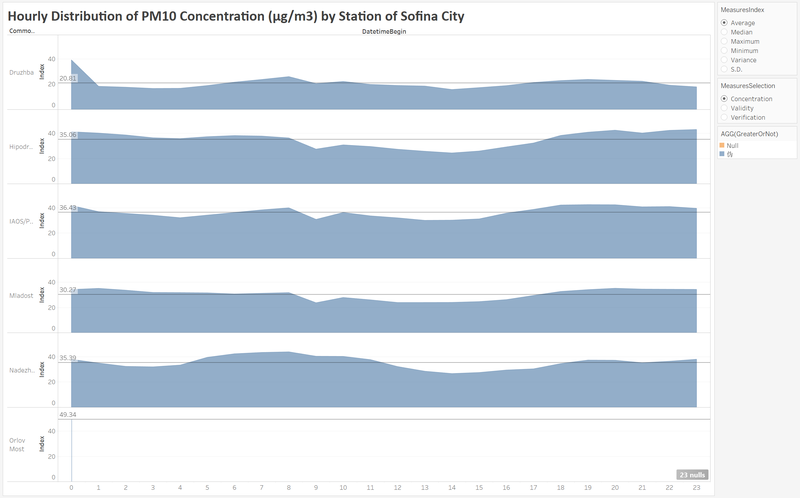
| The average concentration is around 41 for typical days of Sofia city. From the diagram above, the average concentration floats up and down around the overall concentration for each station. The station that has the lowest average concentration is Mladost station, but it only has one-year data. So, the description of Mladost station is not accurate. It can be regarded as a certain reference value. From the diagram above, it is clearly to see that the average concentration reaches a peak at 8am in a typical day. The reason maybe because that the traffic reaches its peak time between 8 and 9 in the morning. The main automobile exhaust gases are considered as the major source of PM10. After peak time the average concentration decreases during 11am to 5pm and dropped to the low at 2pm in a typical day. | |
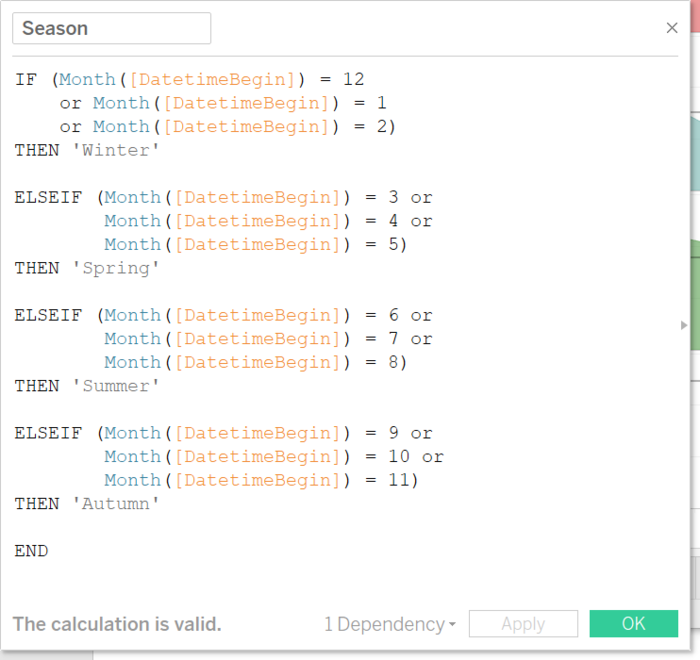
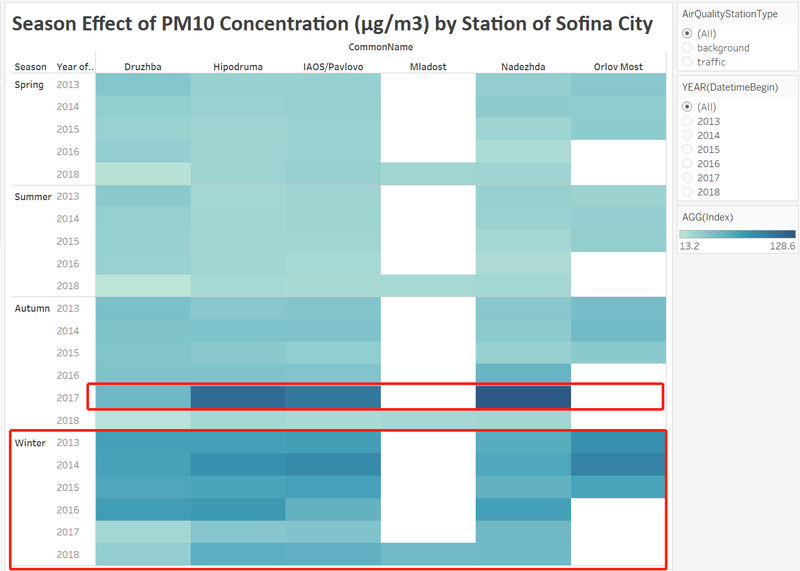
| Using the above formula to create a SEASON, it proves that the average concentration indeed increases in winter on a seasonal basis. | |
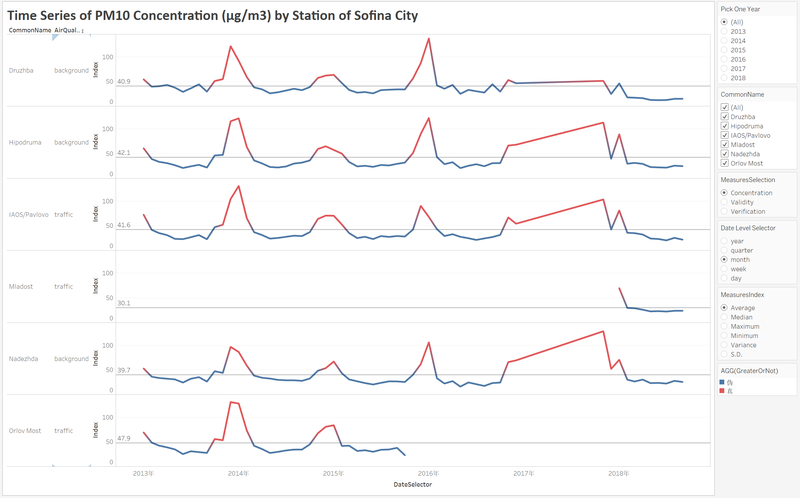
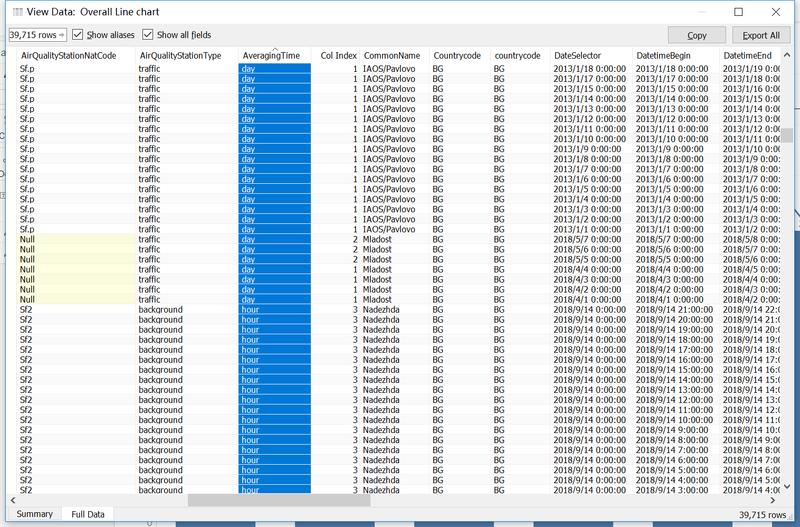
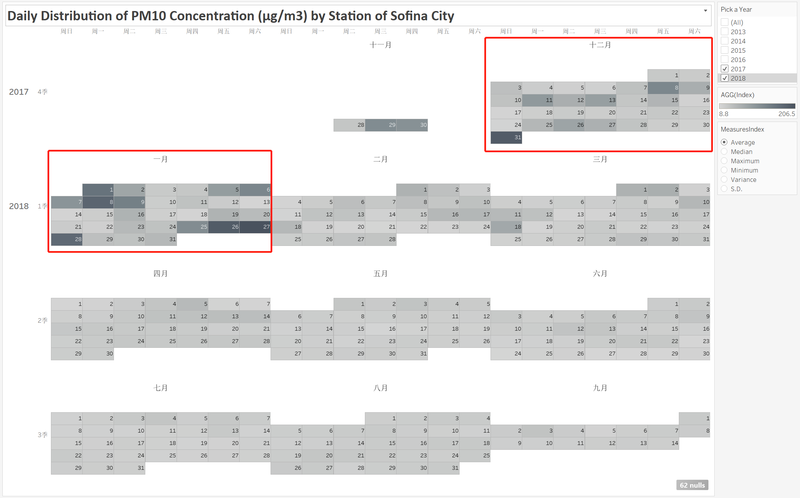
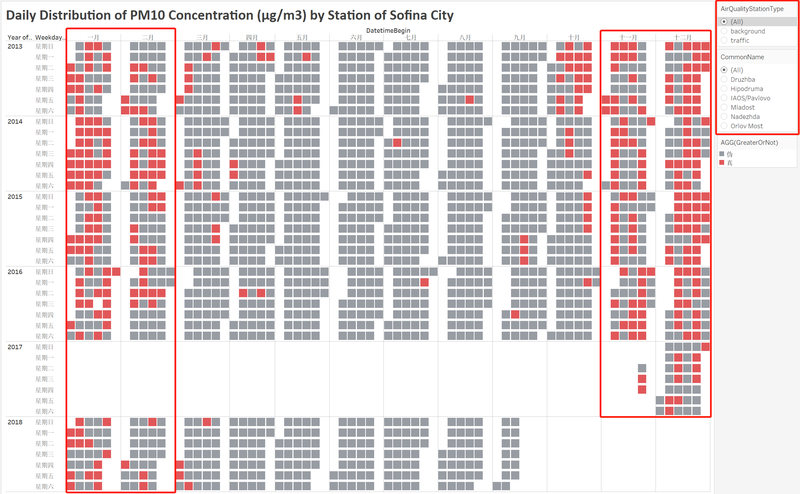
| The anomalies in the official air quality dataset show that there are many missing data. Using the heatmap calendars to figure out the missing data and illustrate the average concentration in a typical date. The data of 2017 only includes November and December. We cannot to illustrate and analyze the whole year just basing on two-month data. There are also missing data in 2018. We cannot analysis whether the average concentration in the winter will rise or not. Zoom into the station, for Mladost station, it only consists data in 2018, which is also not completed. For Orlov Most station, it misses the data of 2013.08, and 2015,11 to 2018.09. For this reason, we are hardly to analyze the overall trends. It will be not accurate.
|
