ISSS608 2018-19 T1 Assign Zhang Yanli Task2

From Visual Analytics and Applications
Revision as of 22:11, 18 November 2018 by Yanli.zhang.2017 (talk | contribs)
Jump to navigation Jump to search
Zylciti.jpg

Spatio-temporal patterns of air quality in Sofia City

Background

Task1

Task2

Task3

Methodology & Dashboard Design

Task 2: Spatio-temporal Analysis of Citizen Science Air Quality Measurements

decrption 2017 2018
Are they well distributed over the entire city?


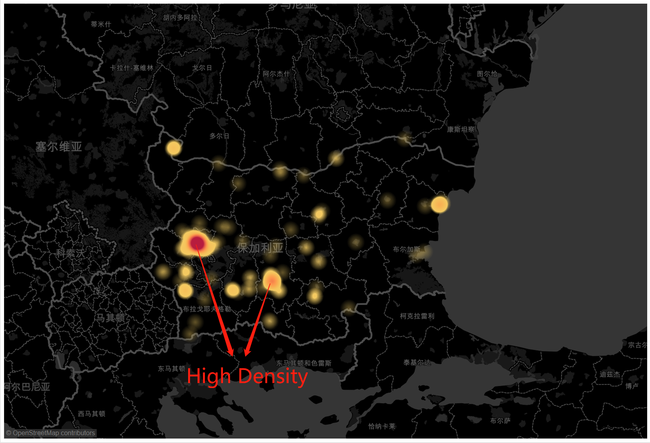
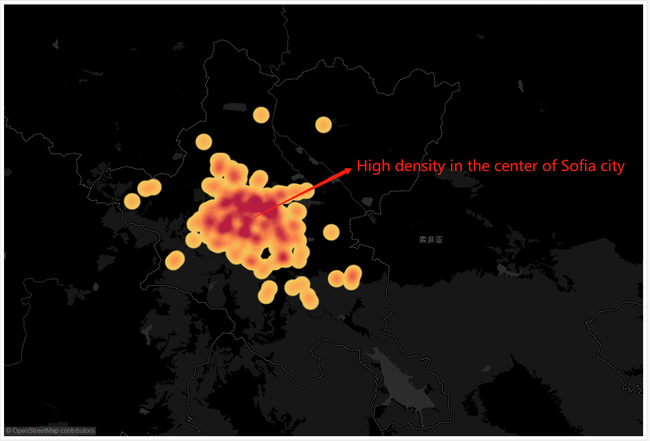
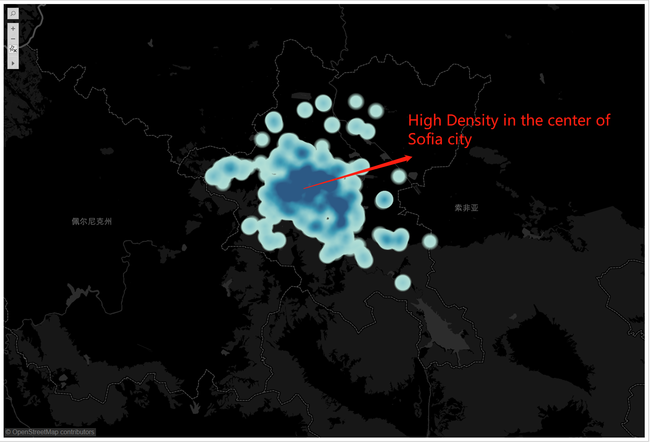
We are able to locate all sensors on the map after getting related longitude and latitude data that are decoded by ‘geohash’. From the data of 2017, we can know that there are 383 sensors over the entire area, not just distributed in Sofia city. We get 240 marks by using “Lasso selection tool” to choose the data we need. The number of sensor in Sofia city accounts 60% of the total. It is clearly that the sensors concentrate in the center of the Sofia city from the above pictures. Density of sensor in urban is low. Then, as time goes on and the sensors rise from 123 to 231 by 20 per month. However, the growth rate of urban sensor is slower than the center of Sofia city.


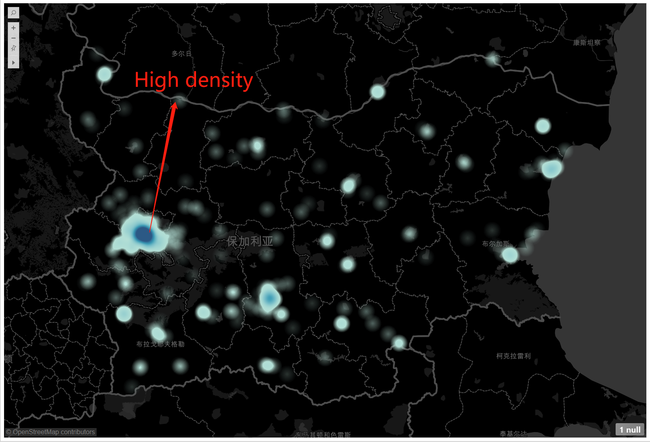
The sensors in the entire area increase to 1253 in 2018, which is 10 times the number used to be. There are 712 sensors in Sofia city, which account more than 50%. The sensors in Sofia city increase 472 in 2018 comparing to 2017. The urban sensors increase as well, but mostly are distributed in the center of the city. Especially, there is no sensor at the bottom right corner in the map.
{
Zyl2017.png
Zyl20172.png
}
{
Zyl2018.png
Zyl20182.png
}