ISSS608 2018-19 T1 Assign Wu Jinglong Task2
Revision as of 21:56, 18 November 2018 by Jinglong.wu.2017 (talk | contribs)
|
|
|
|
|
|
|
Data preparation
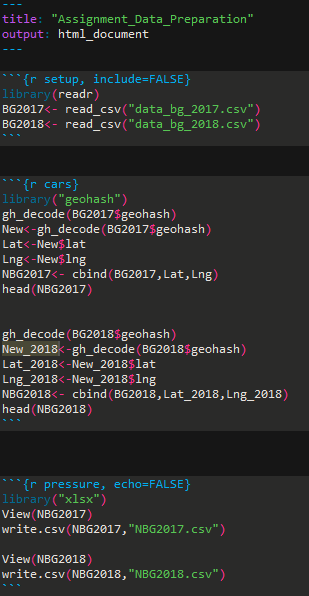
For 2017 and 2018 data files, geohash decoding is done separately By running following R code, the geo location data can be abstracted. In the end two data files "NBG2017.csv" and "NBG2018.csv" are generated, after data exploration I decided not to join the data cause some of the station names can't be mapped.
Performance
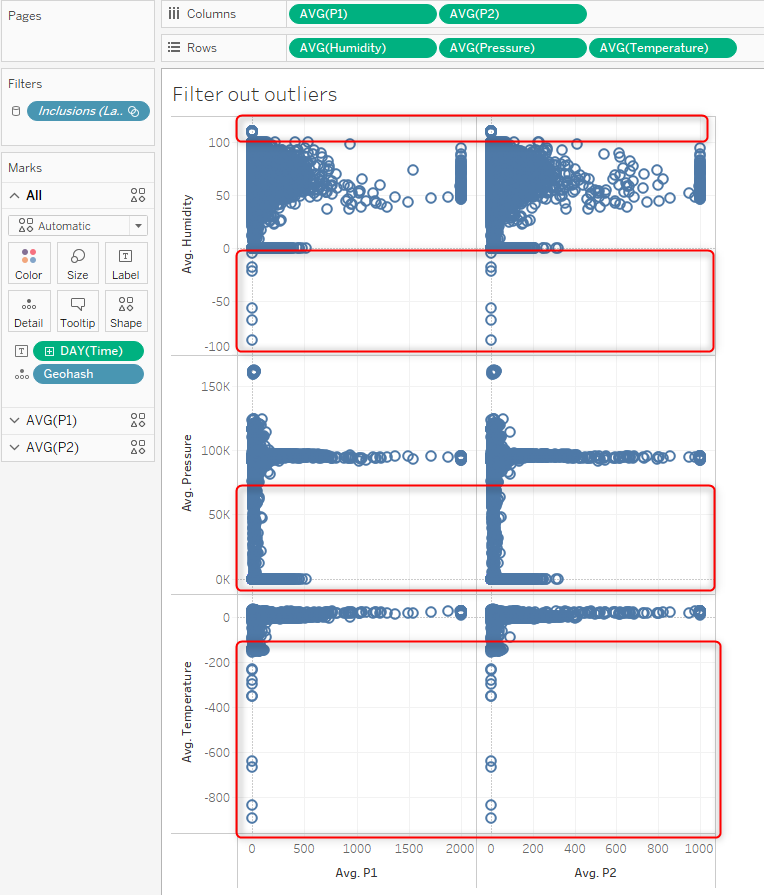
We observed that there is data outlier in temperature, humidity and pressure data. Which means not all sensors are working properly at all times. Tableau filter is used to filter out unrealistic values.


