ISSS608 2018-19 T1 Assign Cao Xinjie DataPrep
|
|
|
|
|
|
TASK1 DATA PREPARATION
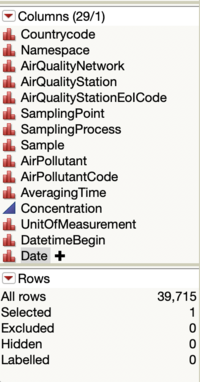
The data for tsak1 is EEA Data. There totally 28 timeseries data and a metadata. After using JMP to concatenate all the time series data, we use "AirQuantityStation" to be the matching value join the timeseries data and the matadata..
.
After joining the data there is 29 Columns and 39715 Rows.
TASK2 DATASET DESCRIPTION
The Air Tube data is for the task2, we use R to join the data and get the Longitude and latitude form the Geohash code. Geohash is a public domain geocoding system invented by Gustavo Niemeyer[1], which encodes a geographic location into a short string of letters and digits. It is a hierarchical spatial data structure which subdivides space into buckets of grid shape, which is one of the many applications of what is known as a Z-order curve, and generally space-filling curves. Geohashes offer properties like arbitrary precision and the possibility of gradually removing characters from the end of the code to reduce its size (and gradually lose precision). As a consequence of the gradual precision degradation, nearby places will often (but not always) present similar prefixes. The longer a shared prefix is, the closer the two places are..
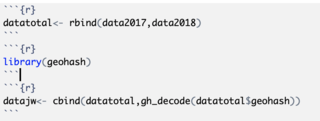
The following figure show the code of R.
gh_decode is a code to transform the geohash number to longitude and latitude. When we have the longitude and latitude we can use the Tableau to do the analysis based on map.
TOOLS
ggplot2
tidyverse
zoo
shiny


