ISSS608 2018-19 T1 Assign Qiao Xueyu Methodology
|
|
|
|
|
|
Data Exploration & Preparation
Official Air Quality Measurements
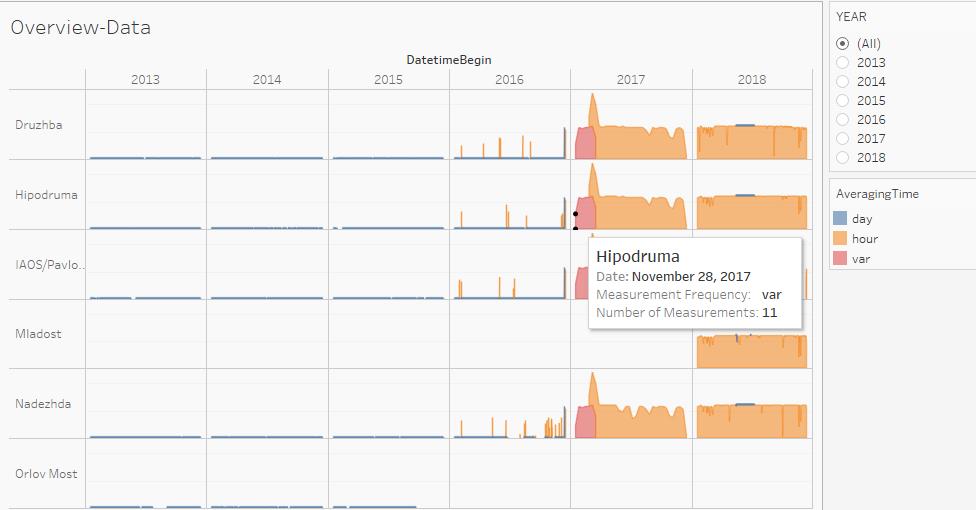
This is the official air quality data which contains 6 stations PM10 concentration from 2013-01-01 to 2018-09-14. The concentration is measured on a daily basis from 2013 to 2017 and on a hourly basis in 2018.
On the figure above, the height of areas represents the number of time of measurements on each day.
From this figure, we can notice that the measurement was taken hourly from 2013 to 2015, hourly on certainly days in 2016, and from 2017 onwards, the measurement was mainly taken hourly. This means we do not have hourly data from 2013 to 2016.
It's also worth noticing that the station of Mladost started operation only from 2018 and the station of Oriov Most stopped operation in the third quarter of 2016.
Except the measurements from 2013 to 2018, we also have the metadata contains the information of each station including their geographical details, distance to building and curb, station types and so on. We will join the data of 6 years with the metadata in Tableau for the exploration and visualization.
Citizen Science Air Quality Measurements
The

