ISSS608 2018-19 T1 Assign Huang Shan
|
|
|
|
|
|
Follow the pipit to view the interactive story on Tableau:

Contents
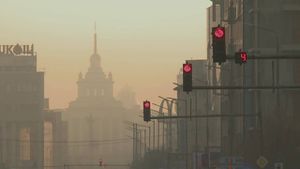
Introduction into Sofia Air Pollution Crisis
In Bulgaria’s capital city Sofia, air pollution norms were exceeded 70 times in the heating period from October 2017 to March 2018, citizens’ initiative AirBG.info told a news conference on April 4, the eve of the first anniversary of the announcement of the group’s founding. The day with the worst air pollution in Sofia was January 27, when the norm was exceeded six times over, at 331 units per cubic metre. This was a record for all areas where the group has sensors.The group joined the Luftdaten.info network in 2017 and announced its founding on April 5, the day that the European Court of Justice (ECJ) said that it had ruled against Bulgaria in a case brought by the European Commission against the country over its failure to implement measures to reduce air pollution.There are 300 sensors measuring air quality in Sofia and more than 600 in various parts of Bulgaria.
AirBG.info’s Stefan Dimitrov said that by now, the group had taken about 42 million measurements of air.Petar Kirov of the group said that the youngest volunteer participating in the group was 13 years old and the oldest, 76.Svetoslav Ivanov said the two main reason for the air pollution were solid fuel heating and motor vehicle traffic. This kind of heating, in combination with temperature inversions in winter, were the most serious problem in Sofia and other large cities in Bulgaria including Plovdiv, Varna and Blagoevgrad.Other bad days in Sofia this past winter season were January 8, 27 and February 13, when air pollution was about five to six times the norm.Dimitrov said that the good news was that the group’s network was expanding rapidly. The authorities showed interest in the topic of air pollution. The group had held meetings with Environment Minister Neno Dimov, Sofia mayor Yordanka Fandukova and with scientists, and other good news was the decision to carry out measurements jointly with the Environment Executive Agency.
Scope of the work
Task 1: Spatio-temporal Analysis of Official Air Quality
Characterize the past and most recent situation with respect to air quality measures in Sofia City. What does a typical day look like for Sofia city? Do you see any trends of possible interest in this investigation? What anomalies do you find in the official air quality dataset? How do these affect your analysis of potential problems to the environment?
Task 2: Spatio-temporal Analysis of Citizen Science Air Quality Measurements
Characterize the sensors’ coverage, performance and operation. Are they well distributed over the entire city? Are they all working properly at all times? Can you detect any unexpected behaviors of the sensors through analyzing the readings they capture? Now turn your attention to the air pollution measurements themselves. Which part of the city shows relatively higher readings than others? Are these differences time dependent?
Task 3: Factors and Measurements Involved In Air Quality
Urban air pollution is a complex issue. There are many factors affecting the air quality of a city. Some of the possible causes are: Local energy sources. For example, according to Unmask My City, a global initiative by doctors, nurses, public health practitioners, and allied health professionals dedicated to improving air quality and reducing emissions in our cities, Bulgaria’s main sources of PM10, and fine particle pollution PM2.5 (particles 2.5 microns or smaller) are household burning of fossil fuels or biomass, and transport. Local meteorology such as temperature, pressure, rainfall, humidity, wind etc Local topography Complex interactions between local topography and meteorological characteristics. Transboundary pollution for example the haze that intruded into Singapore from our neighbours.
Date Source
Four major data sets in zipped file format are provided for this assignment, they are:
- Official air quality measurements (5 stations in the city)(EEA Data.zip)
- Citizen science air quality measurements (Air Tube.zip)
- Meteorological measurements (1 station)(METEO-data.zip)
Software Applications
- RStudio: tidyverse, geohash
- SAS JMP Pro 13
- Tableau Desktop 2018.3

