Task 3: Other Factors Affecting Air Quality
|
|
|
|
|
|
|
Understanding other factors affecting air quality in Sofia
Contents
Overview
According to Unmask My City, a global initiative dedicated to improving air quality and reducing emissions in cities, Bulgaria’s sources of air pollution includes household burning of fossil fuels or biomass, and transport. Specifically, coal plants are responsible for most of Bulgaria’s PM10 and fine particle pollution PM2.5 (particles 2.5 microns or smaller) e.g. sulfur dioxide and nitrogen oxide emissions.
For this task, we will examine the possible industrial reasons attributing to the air pollution situation in Sofia e.g. presence of thermal power plants, transboundary pollution etc. We also attempt to undercover the relationship between natural factors such as local meteorology and topography, and their impact on the trends highlighted in earlier tasks.
Potential factor 1: Meteorology in Sofia City
Local meteorology factors such as temperature, pressure, rainfall, humidity, wind are represented in the “METEO” dataset provided.
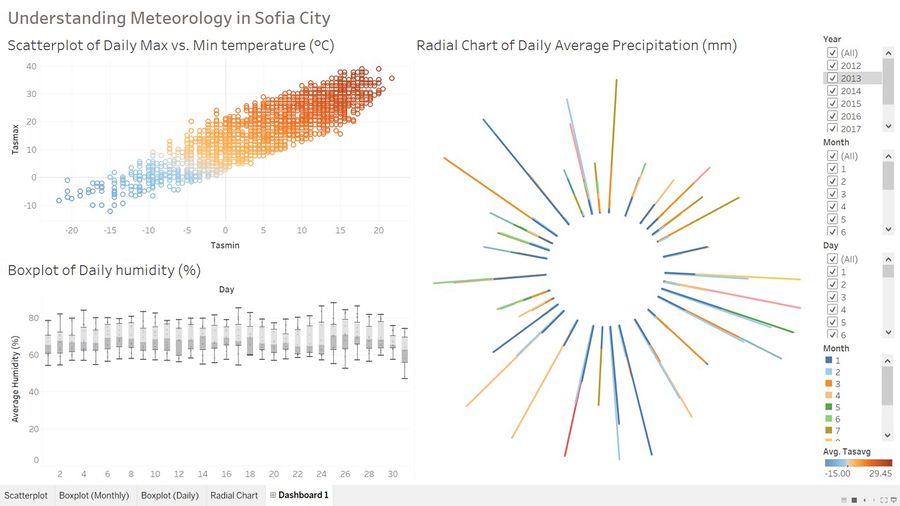
To better understand the interaction between various meteorology factors, we have built a Tableau Dashboard to visualize changes in humidity, temperature and precipitation across years, months and days.
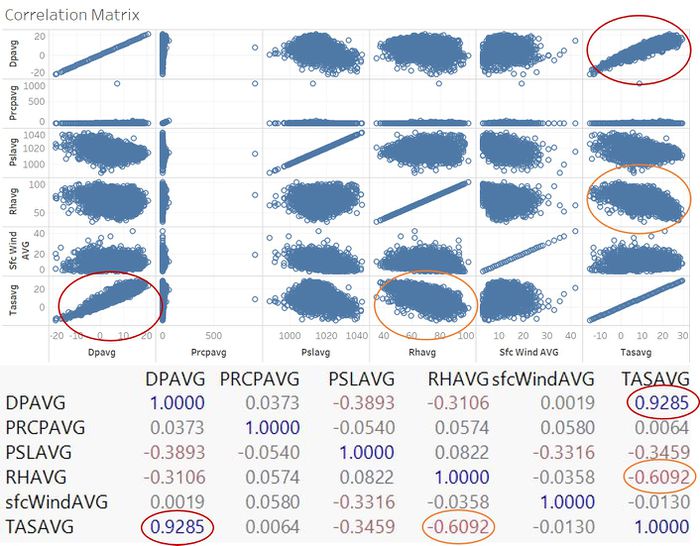
Strong correlation between temperature and dew point temperature, moderate correlation between temperature and humidity
A correlation chart was plotted to display the correlation between various meteorology factors. Most notably, there is strong positive correlation between temperature and dew point temperature. Another observation made was there is moderate negative correlation between temperature and humidity i.e. the higher the temperature, the less humid the climate. Even though research has shown that higher temperature worsen pollution problem [1], this is not reflected in our visualization as the concentration of PM2.5 and PM10 is observed to be higher in colder months. This could be due to social and lifestyle reasons where residents consume more thermal energy in winter seasons.
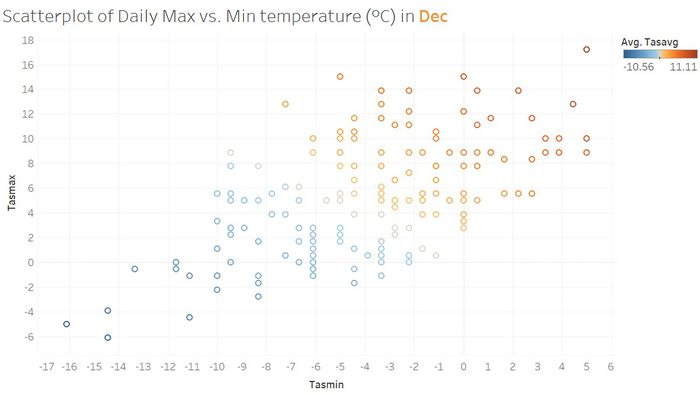
Winters in Sofia City have high humidity and lower temperature
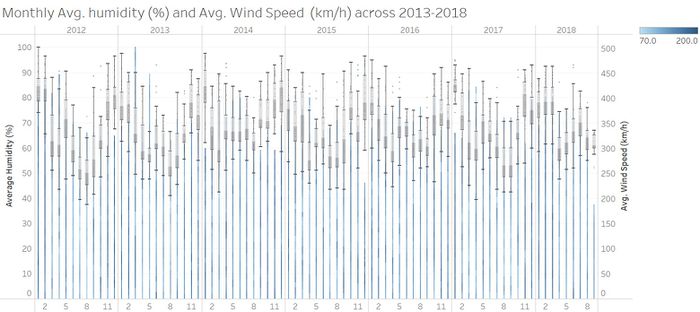
Average humidity level in winter (December) can go above 100% as compared to 60-70% range during summer seasons (June). This could be a plausible reason for higher pollutant concentration in December and January compared to other months.
Nonetheless, the phenomenon can also be explained by social and health reasons e.g. more household consume thermal power to heat up their homes during winter season.
Seasonal Trend observed for humidity and wind speed
Wind speed is observed to be higher during start and end of year. This coincides with the colder months and might a contributing factor for higher pollutant concentration during winter alongside lower temperature and higher humidity.
Precipitation shows seasonal trend across months collective but not days
Interestingly, there is no significant changes in volume or frequency of precipitation across the days of the month regardless of season. While instinctively rainfall might be perceived as having a "washdown" effect on the pollutants hovering in the air, for the case of Sofia City, it is not a significant factor for consideration when explaining pollutant concentration in air.
Potential factor 2: Topography of Sofia City
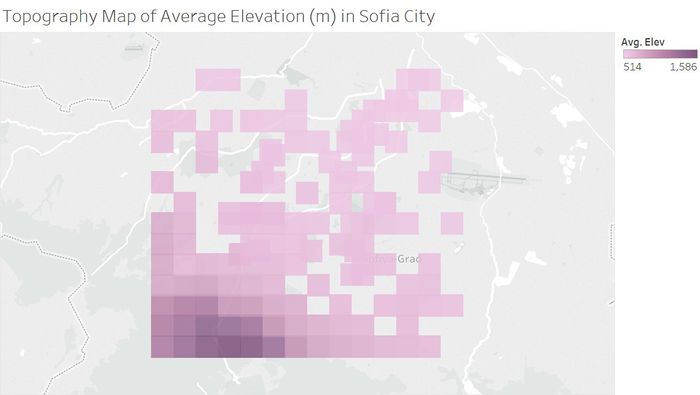
Higher Elevation towards south west of Sofia City
According to our plotted density graph of elevation, areas with higher elevation i.e. mountainous area are shown with darker shading. It is noticeable that area south west to Sofia City is much higher compared to its northern and eastern counterparts. From qualitative research [2], we understand that altitude may have an impact on pollutant count. In general, areas at lower altitude is more likely to be plagued with pollution. As altitude increases, heavier pollutants find is harder to travel upwards.
Potential factor 3: Presence of Power Plant
A thermal power station is a power station in which heat energy is converted to electric power. In most of the places in the world the turbine is steam-driven. Water is heated, turns into steam and spins a steam turbine which drives an electrical generator. This process is fueled by burning coals which releases sulfur dioxide, nitrogen oxides, particulate matter (PM), and heavy metals.
Presence of 2 active power plants within Sofia City Centre
Presence of active power plant, coupled with topography factor, could be reason for high concentration of pollutants at city center.
Presence of 1 power plant at Sofia City fringe and 1 large thermal power plant 60km away
Bodov Dol Power Plant is one of the largest thermal power plant in the region with an installed capacity of 630MW. It is situated approximately 60km away from Sofia City. In comparison, Republika Power Plant which is situated at Pernik, is much closer to Sofia City at approximately 25km away. Due to proximity consideration, pollutant discharge from Republika Power Plant is more likely to be transported to Sofia City.
