Group06 Proposal
Gee-Whiz: Singapore and the suppliers that make her tick
A visual exploration of relationships between government agencies and suppliers.
|
|
|
|
|
|
Contents
Project Overview
Set up in June 2000, the Government Electronic Business (GeBIZ) Portal is an integrated portal for use by all Singapore government agencies to conduct business electronically with their suppliers. As a one-stop center for suppliers to have access to all procurement opportunities in the public sector and to trade electronically with the government, GeBIZ creates an entry point for businesses to access ‘government-to-business’ services.
There are more than S$10 billion worth of business opportunities published annually to 30,000 suppliers registered with GeBIZ. Over the years, GeBIZ has accumulated a knowledge base of procurement data and this massive amount of data can be harnessed as a valuable source of market knowledge.
We will be exploring ways to help visualize the relationships between government agencies and their suppliers, increasing the ability to gain valuable insights. Primarily, we will be exploring network graphs using a R shiny application to help visualize the relationships between the Ministries, Agencies and Suppliers together with other supplementary visualizations.
Dataset & Preparation
The dataset we will use for our application is sourced from Data.gov.sg
This dataset contains information on successful tenders from January 2015 to December 2017. The structure of the dataset is as seen below:
The process diagram below illustrates our approach to data preparation. The existing dataset only contains agency information. There are no details regarding which ministries these agencies belong to. We will supplement the original data with externally sources information on the mapping. Furthermore, our dataset contains rows for tenders which were not awarded to any supplier. This information is not of interest for our project and will be filtered away. Subsequently, the dataset can be used for preparing the visualizations discussed in the next section.
Visualization Storyboard
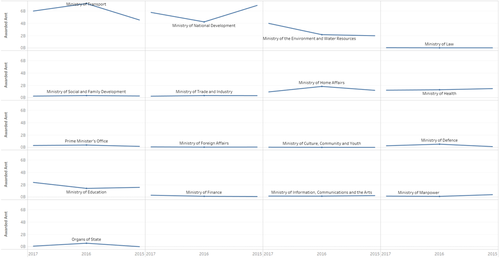
| Timeseries Charts
Timeseries charts will draw out seasonality patterns in the tenders awarded. || |
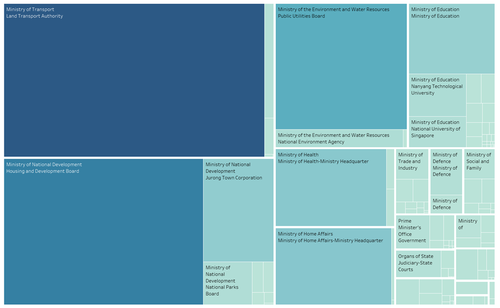
| Treemap
A treemap will breakdown the spend by each ministry into the relevant agencies and then the suppliers. || |
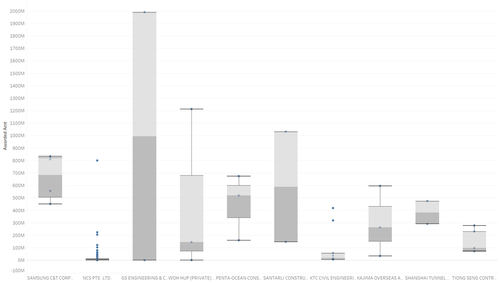
| Boxplot
A boxplot will display the tenders of the top 10 most influential suppliers. || |
| Network Graph
A network graph will be used to visualize the size of transactions between government agencies and suppliers. || |
Tools and Packages Used
We primarily intend to use the various R packages below:
- dplyr
- ggplot2
- lubridate
- tidyr
- tibble
- tidyverse
- treemap
- d3treeR
- tidygraph
- igraph
- ggraph
- visNetwork
- shiny
- shinydashboard


