Difference between revisions of "Task 2: Citizen Science Air Quality"
Jump to navigation
Jump to search
Yqchia.2017 (talk | contribs) |
Yqchia.2017 (talk | contribs) |
||
| Line 34: | Line 34: | ||
==Characteristics of sensors’ coverage, performance and operation== | ==Characteristics of sensors’ coverage, performance and operation== | ||
| − | === | + | === Number and distribution of sensors === |
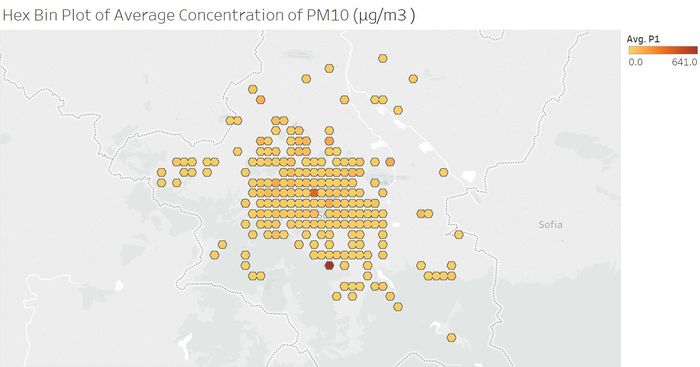
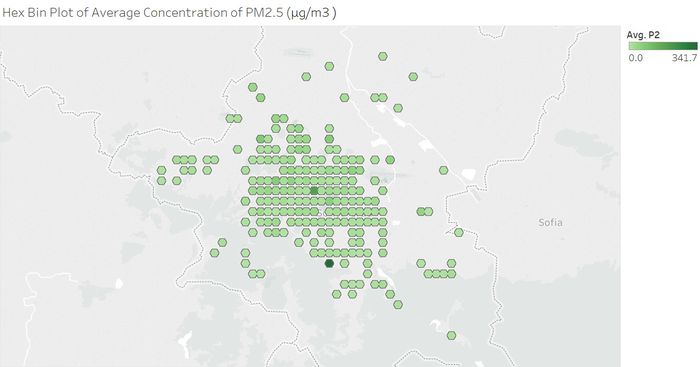
| − | + | ''' Congregation of sensors at City Center'''<br/> | |
| − | |||
| − | ''' | ||
[[File:Hexbin PM10.jpg|700px|frameless|left]]<br/> | [[File:Hexbin PM10.jpg|700px|frameless|left]]<br/> | ||
[[File:Hexbin PM2.5.jpg|700px|frameless|left]]<br/> | [[File:Hexbin PM2.5.jpg|700px|frameless|left]]<br/> | ||
| − | |||
| − | |||
| − | |||
| − | |||
| − | |||
| − | |||
| − | |||
| − | |||
| − | |||
| − | |||
| − | |||
| − | |||
| − | |||
| − | |||
| − | |||
| − | |||
| − | |||
| − | |||
| − | |||
| − | |||
| − | |||
| − | |||
| − | |||
| − | |||
| − | |||
| − | |||
| − | |||
| − | |||
| − | |||
| − | |||
| − | |||
| − | |||
| − | |||
| − | |||
| − | |||
| − | |||
| − | |||
| − | |||
| − | |||
| − | |||
| − | |||
| − | |||
| − | |||
| − | |||
| − | |||
| − | |||
| − | |||
| − | |||
| − | |||
| − | |||
| − | |||
| − | |||
| − | |||
| − | |||
| − | |||
| − | |||
| − | |||
| − | |||
| − | |||
| − | |||
| − | |||
| − | |||
| − | |||
| − | |||
| − | |||
| − | |||
| − | |||
| − | |||
| − | |||
| − | |||
| − | |||
| − | |||
| − | |||
| − | |||
| − | |||
| − | |||
| − | |||
| − | |||
| − | |||
| − | |||
| − | |||
| − | |||
=== Performance of sensors === | === Performance of sensors === | ||
Revision as of 22:06, 18 November 2018
|
|
|
|
|
|
|
Understanding Citizen Science Air Quality Data
Contents
Characteristics of sensors’ coverage, performance and operation
Number and distribution of sensors
Congregation of sensors at City Center
