Difference between revisions of "Task 2: Citizen Science Air Quality"
Jump to navigation
Jump to search
Yqchia.2017 (talk | contribs) |
Yqchia.2017 (talk | contribs) |
||
| Line 34: | Line 34: | ||
==Characteristics of sensors’ coverage, performance and operation== | ==Characteristics of sensors’ coverage, performance and operation== | ||
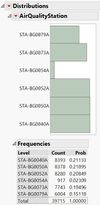
| − | === | + | === Coverage of sensors === |
| + | |||
| + | [[File:Distribution station.jpg|100px|frameless|left]]<br/> | ||
| + | |||
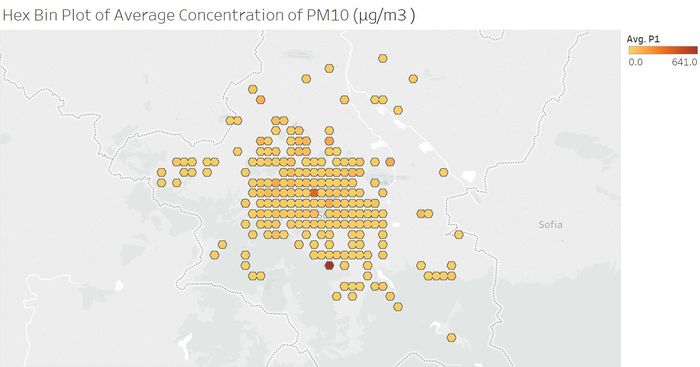
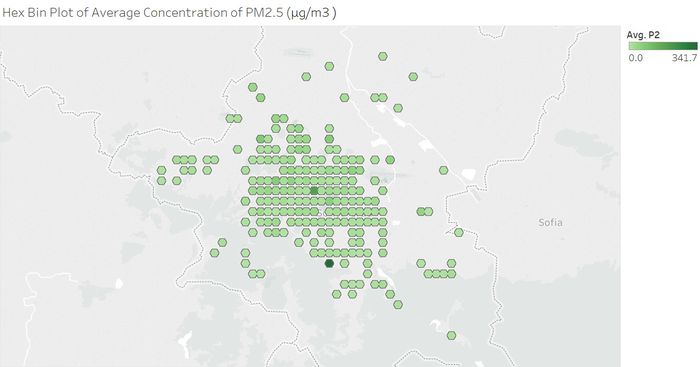
| + | '''Number and distribution of sensors'''<br/> | ||
| + | [[File:Hexbin PM10.jpg|700px|frameless|left]]<br/> | ||
| + | [[File:Hexbin PM2.5.jpg|700px|frameless|left]]<br/> | ||
| + | |||
| + | |||
| + | |||
| + | |||
| + | |||
| + | |||
| + | |||
| + | |||
| + | |||
| + | |||
| + | |||
| + | |||
| + | |||
| + | |||
| + | |||
| + | |||
| + | |||
| + | |||
| + | |||
| + | |||
| + | |||
| + | |||
| + | |||
| + | |||
| + | |||
| + | |||
| + | |||
| + | |||
| + | |||
| + | |||
| + | |||
| + | |||
| + | |||
| + | |||
| + | |||
| + | |||
| + | |||
| + | |||
| + | |||
| + | |||
| + | |||
| + | |||
| + | |||
| + | |||
| + | |||
| + | |||
| + | |||
| + | |||
| + | |||
| + | |||
| + | |||
| + | |||
| + | |||
| + | |||
| + | |||
| + | |||
| + | |||
| + | |||
| + | |||
| + | |||
| + | |||
| + | |||
| + | |||
| + | |||
| + | |||
| + | |||
| + | |||
| + | |||
| + | |||
| + | |||
| + | |||
| + | |||
| + | |||
| + | |||
| + | |||
| + | |||
| + | |||
| + | |||
| + | |||
| + | |||
| + | |||
| + | |||
| + | |||
| + | |||
| + | |||
| + | |||
| + | |||
| + | |||
| + | |||
| + | |||
| + | |||
| + | |||
| + | |||
| + | |||
| + | |||
| + | |||
| + | |||
| + | |||
| + | |||
| + | |||
| + | |||
| + | |||
| + | |||
| + | |||
| + | |||
| + | |||
| + | |||
| + | |||
| + | |||
| − | |||
| − | |||
| − | |||
=== Performance of sensors === | === Performance of sensors === | ||
Revision as of 22:04, 18 November 2018
 Understanding Air Quality in Sofia
|
|
|
|
|
|
|
Understanding Citizen Science Air Quality Data
Contents
Characteristics of sensors’ coverage, performance and operation
Coverage of sensors

Number and distribution of sensors


Performance of sensors
Distribution of air pollutant in Sofia City
Which part of the city shows higher concentration in air pollutant?
Is difference in concentration time dependent?

