Difference between revisions of "Assignment ZUOANNA Task 2"
Jump to navigation
Jump to search
| Line 1: | Line 1: | ||
| − | + | '''Spatio-temporal Analysis of Citizen Science Air Quality Measurements''' | |
| + | =Methodology= | ||
==Data Preparation== | ==Data Preparation== | ||
{| class="wikitable" | {| class="wikitable" | ||
| Line 11: | Line 12: | ||
|| [[File:T1Z.png|400px|center]] | || [[File:T1Z.png|400px|center]] | ||
|} | |} | ||
| + | |||
| + | =Insights & Dashboard Design= | ||
==Characterize the Sensors’ Coverage, Performance and Operation== | ==Characterize the Sensors’ Coverage, Performance and Operation== | ||
{| class="wikitable" | {| class="wikitable" | ||
Revision as of 09:26, 18 November 2018
Spatio-temporal Analysis of Citizen Science Air Quality Measurements
Contents
Methodology
Data Preparation
| Description | Illustration |
|---|---|
|
Insights & Dashboard Design
Characterize the Sensors’ Coverage, Performance and Operation
| Description | Dashboard Visualization |
|---|---|
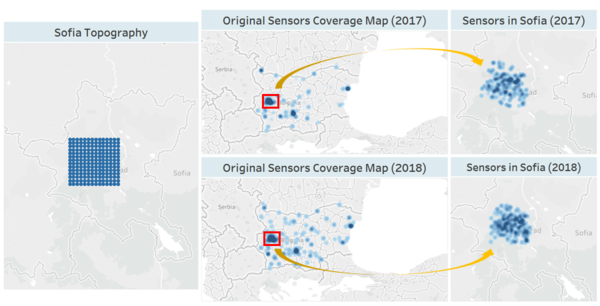
Coverage—Sensors are not only distributed over the Sofia City
|
|
| Performance—Not all the sensors perform well at any time
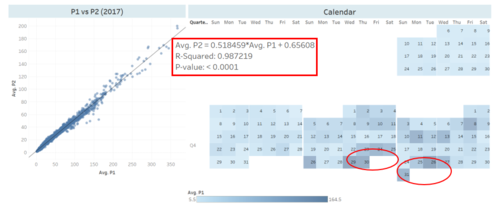
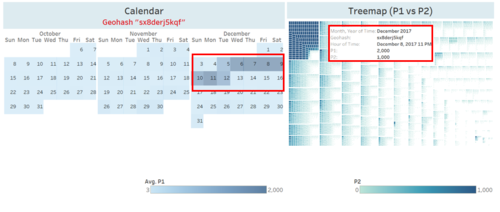
The dashboard above provides more information on the timeseries for each sensor in 2017.
|
|
Operation
|
Air Pollution Measurements
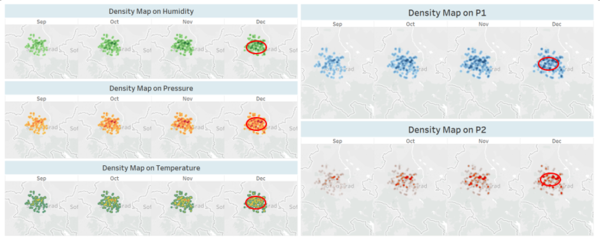
Which part of the city shows relatively higher readings than others?
| Description | Dashboard Visualization |
|---|---|
Sensors in Year 2017
|
|
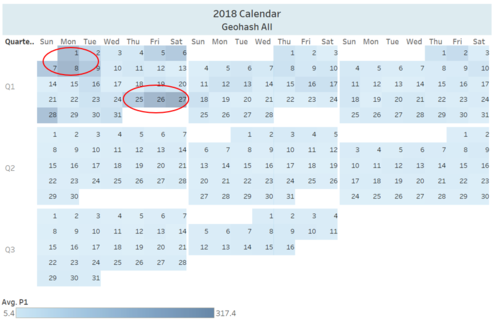
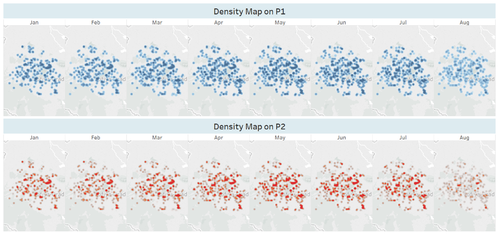
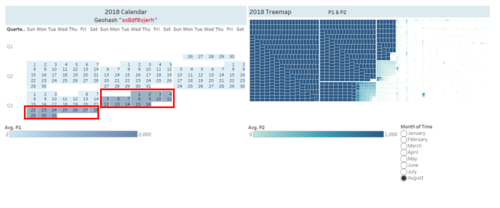
Sensors in Year 2018
|
