Difference between revisions of "Task 1: Official Air Quality"
Jump to navigation
Jump to search
Yqchia.2017 (talk | contribs) |
Yqchia.2017 (talk | contribs) |
||
| Line 36: | Line 36: | ||
===Changes from 2013 to 2018=== | ===Changes from 2013 to 2018=== | ||
| − | [[File:Slope | + | [[File:Slope graph1.jpg|1000px|frameless|left]] |
Revision as of 20:47, 18 November 2018
|
|
|
|
|
|
|
Spatio-temporal Analysis of Official Air Quality
Contents
Comparison of Past and Present Air Quality Situation in Sofia
Characterize the past and most recent situation with respect to air quality measures in Sofia City. What does a typical day look like for Sofia city?
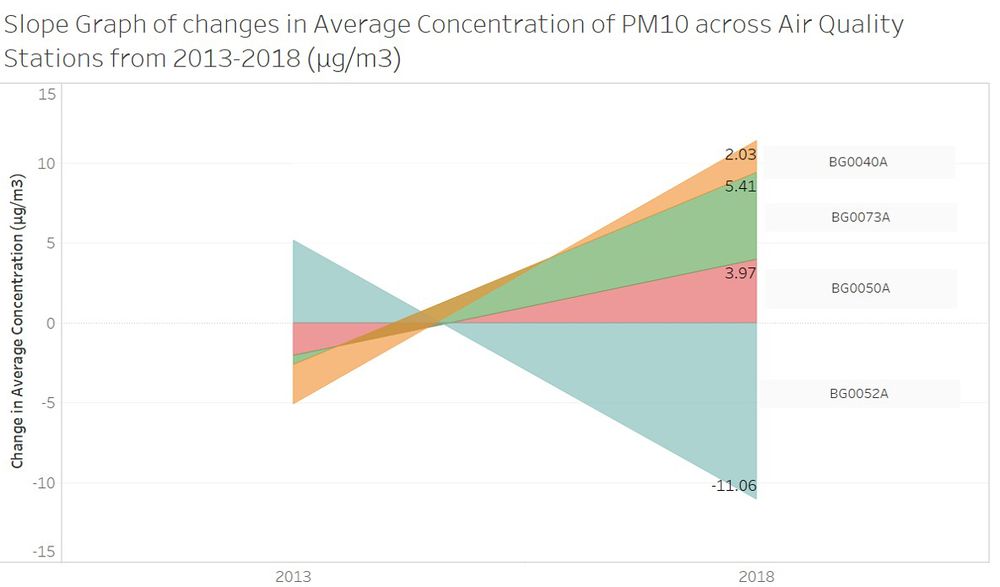
Changes from 2013 to 2018
Discovered Trends of Interest=
Anomalies in dataset
Missing dataset for STA-BG0054A from 2016-2018 Data from STA-BG0054A (Orlov Most) is missing from 2016-2018. This could be possible decommissioning of the air quality station from 2016 onwards.
New Air Quality Station in 2018 – STA- BG0079A (Orlov Most) Dataset for Orlov Most covers only the first 9 months of 2018.
Incorrect altitude level for STA-BG0079A (Mladost) In the metadata table provided, we noticed that altitude for STA-BG0079A (Mladost) set as “0” is likely to be an error as Sofia city sits at 550m above sea level.

