Difference between revisions of "Sofia City: Data Preparation"
Yqchia.2017 (talk | contribs) |
Yqchia.2017 (talk | contribs) |
||
| (24 intermediate revisions by the same user not shown) | |||
| Line 1: | Line 1: | ||
| − | <div style=background:# | + | <div style=background:#314251 border:#314251> |
| − | [[ | + | [[File:Banner.jpg|300px|frameless]] |
| − | <font size = 5; color="# | + | <font size = 5; color="#f4f6f7"> Understanding Air Quality in Sofia </font> |
</div> | </div> | ||
<!--MAIN HEADER --> | <!--MAIN HEADER --> | ||
| Line 11: | Line 11: | ||
| style="font-family:Century Gothic; font-size:100%; solid #1B338F; background:#173654; text-align:center;" width="20%" | | | style="font-family:Century Gothic; font-size:100%; solid #1B338F; background:#173654; text-align:center;" width="20%" | | ||
; | ; | ||
| − | [[Sofia City: Data Preparation| <font color="#f4f6f7">Data Preparation</font>]] | + | [[Sofia City: Data Preparation| <font color="#f4f6f7">Data Preparation & Dashboard</font>]] |
| style="font-family:Century Gothic; font-size:100%; solid #1B338F; background:#173654; text-align:center;" width="20%" | | | style="font-family:Century Gothic; font-size:100%; solid #1B338F; background:#173654; text-align:center;" width="20%" | | ||
| Line 30: | Line 30: | ||
|} | |} | ||
<br/> | <br/> | ||
| + | <font size="4">'''Data Preparation'''</font> | ||
| + | |||
| + | ==EEA Dataset== | ||
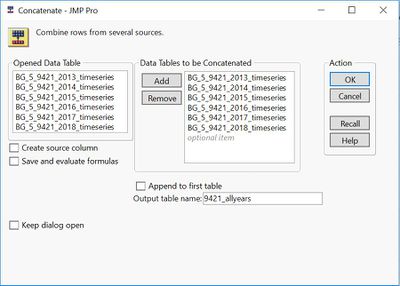
| + | The EEA folder comes with 28 files across 6 stations from 2013-2018. It is observed that some of the stations do not have complete records (denoted by x in table below) across the years notably Orlov Most and Mladost. We first consolidate the dataset for each station by concatenating the files from 2013-2018.<br/> | ||
| + | |||
| + | [[File:Info.jpg|750px|frameless|left]]<br/> | ||
| + | |||
| + | |||
| + | |||
| + | |||
| + | |||
| + | |||
| + | |||
| + | |||
| + | |||
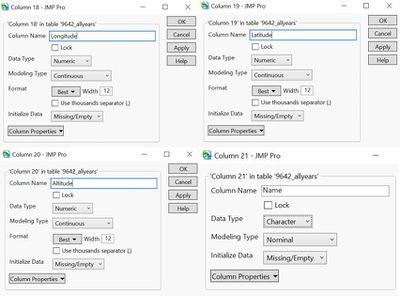
| + | The original files do not come with information on geographical location, altitude as well as common names of the station. These information, however, could be found inside the metadata table provided. We were to add these information into the individual air tube files by creating new columns “Longitude”, “Latitude”, “Altitude” and “Name” respectively.<br/> | ||
| + | |||
| + | [[File:Concat 9421.jpg|400px|frameless|left]] <br/> | ||
| + | |||
| + | |||
| + | |||
| + | |||
| + | |||
| + | |||
| + | |||
| + | |||
| + | |||
| + | |||
| + | |||
| + | |||
| + | |||
| + | |||
| + | [[File:Addincolumns.jpg|400px|frameless|left]] <br/> | ||
| + | [[File:Combine EEA.jpg|450px|frameless|left]] <br/> | ||
| + | |||
| + | |||
| + | |||
| + | |||
| + | |||
| + | |||
| + | |||
| + | |||
| + | |||
| + | |||
| + | |||
| + | |||
| + | |||
| + | |||
| + | |||
| + | |||
| + | |||
| + | |||
| + | |||
| + | |||
| + | |||
| + | |||
| + | |||
| + | |||
| + | |||
| + | |||
| + | |||
| + | |||
| + | |||
| + | |||
| + | |||
| + | |||
| + | |||
| + | |||
| + | |||
| + | |||
| + | |||
| + | |||
| + | |||
| + | |||
| + | |||
| + | |||
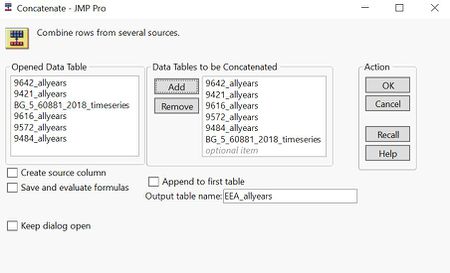
| + | The final working file is created by concatenating dataset from all 6 stations across all years.<br/> | ||
| + | |||
| + | ==Air Tube Dataset== | ||
| + | |||
| + | |||
| + | |||
| + | The Air Tube folder contains data from collected from Citizen Science Air Quality stations over the span of Sep 2017 to Aug 2018. The file comes with a column “Geohash” which encodes the geographic location of air stations into a short string of letters and digits.<br/> | ||
| + | |||
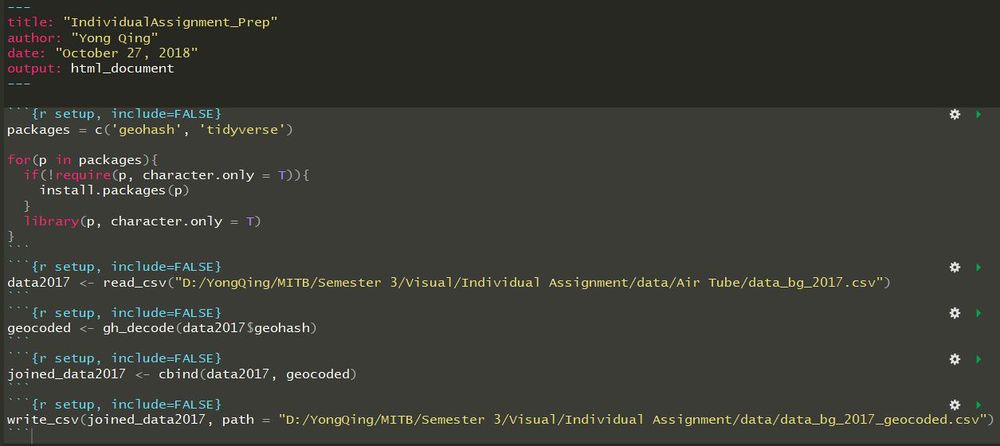
| + | We extracted the corresponding Longitude and Latitude using the R package Geohash.<br/> | ||
| + | |||
| + | [[File:Rcode.jpg|1000px|frameless|left]]<br/> | ||
| + | |||
| + | |||
| + | |||
| + | |||
| + | |||
| + | |||
| + | |||
| + | |||
| + | |||
| + | |||
| + | |||
| + | |||
| + | |||
| + | |||
| + | |||
| + | |||
| + | |||
| + | |||
| + | |||
| + | |||
| + | |||
| + | |||
| + | |||
| + | |||
| + | |||
| + | |||
| + | |||
| + | |||
| + | |||
| + | |||
| + | |||
| + | By concatenating the files from 2017 and 2018, we were able to compile the final working file containing 3610146 rows.<br/> | ||
| + | |||
| + | [[File:Combine AirTube.jpg|450px|frameless|left]] | ||
| + | |||
| + | |||
| + | |||
| + | |||
| + | |||
| + | |||
| + | |||
| + | |||
| + | |||
| + | |||
| + | |||
| + | |||
| + | |||
| + | |||
| + | |||
| + | |||
| + | |||
| + | == Link to Dashboard == | ||
| + | |||
| + | Task 1: Official Air Quality Measure - https://public.tableau.com/profile/chia.yong.qing#!/vizhome/SofiaCityOfficialAirQualityMeasure/Dashboard <br/> | ||
| + | |||
| + | Task 2: Citizen Air Quality Measure - https://public.tableau.com/profile/chia.yong.qing#!/vizhome/SofiaCityCitizenAirQualityMeasure/Dashboard1 <br/> | ||
| + | |||
| + | Task 3: Sofia City: Meteorology factors - https://public.tableau.com/profile/chia.yong.qing#!/vizhome/SofiaCityMeteorology/Dashboard <br/> | ||
Latest revision as of 22:05, 19 November 2018
|
|
|
|
|
|
|
Data Preparation
EEA Dataset
The EEA folder comes with 28 files across 6 stations from 2013-2018. It is observed that some of the stations do not have complete records (denoted by x in table below) across the years notably Orlov Most and Mladost. We first consolidate the dataset for each station by concatenating the files from 2013-2018.
The original files do not come with information on geographical location, altitude as well as common names of the station. These information, however, could be found inside the metadata table provided. We were to add these information into the individual air tube files by creating new columns “Longitude”, “Latitude”, “Altitude” and “Name” respectively.
The final working file is created by concatenating dataset from all 6 stations across all years.
Air Tube Dataset
The Air Tube folder contains data from collected from Citizen Science Air Quality stations over the span of Sep 2017 to Aug 2018. The file comes with a column “Geohash” which encodes the geographic location of air stations into a short string of letters and digits.
We extracted the corresponding Longitude and Latitude using the R package Geohash.
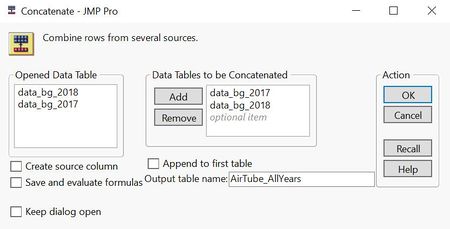
By concatenating the files from 2017 and 2018, we were able to compile the final working file containing 3610146 rows.
Link to Dashboard
Task 1: Official Air Quality Measure - https://public.tableau.com/profile/chia.yong.qing#!/vizhome/SofiaCityOfficialAirQualityMeasure/Dashboard
Task 2: Citizen Air Quality Measure - https://public.tableau.com/profile/chia.yong.qing#!/vizhome/SofiaCityCitizenAirQualityMeasure/Dashboard1
Task 3: Sofia City: Meteorology factors - https://public.tableau.com/profile/chia.yong.qing#!/vizhome/SofiaCityMeteorology/Dashboard


