Difference between revisions of "Assignment ZUOANNA Task 2"
Jump to navigation
Jump to search
| (4 intermediate revisions by the same user not shown) | |||
| Line 1: | Line 1: | ||
| − | + | =Spatio-temporal Analysis of Citizen Science Air Quality Measurements= | |
| − | ==Data Preparation | + | ==Methodology== |
| + | <big>'''Data Preparation'''</big> | ||
{| class="wikitable" | {| class="wikitable" | ||
|- | |- | ||
| Line 11: | Line 12: | ||
|| [[File:T1Z.png|400px|center]] | || [[File:T1Z.png|400px|center]] | ||
|} | |} | ||
| − | ==Characterize the Sensors’ Coverage, Performance and Operation== | + | |
| + | ==Insights & Dashboard Design== | ||
| + | |||
| + | ===Characterize the Sensors’ Coverage, Performance and Operation=== | ||
{| class="wikitable" | {| class="wikitable" | ||
|- | |- | ||
| Line 37: | Line 41: | ||
| − | ==Air Pollution Measurements == | + | ===Air Pollution Measurements === |
| − | + | <big>'''Which part of the city shows relatively higher readings than others?'''</big> | |
{| class="wikitable" | {| class="wikitable" | ||
| Line 45: | Line 49: | ||
! Description !! Dashboard Visualization | ! Description !! Dashboard Visualization | ||
|- | |- | ||
| − | | '''Sensors in Year 2017''' | + | | '''Sensors in Year 2017'''<br><br><br><br> |
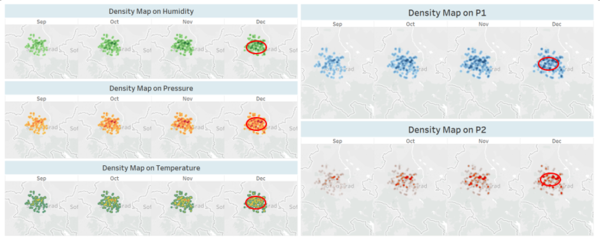
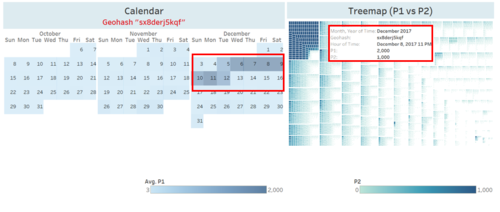
* Since December in 2017 is the month with higher pollution, we filtered the time period to December so that more easily to obtain the patterns on the discharge of the pollution. <br><br><br><br> | * Since December in 2017 is the month with higher pollution, we filtered the time period to December so that more easily to obtain the patterns on the discharge of the pollution. <br><br><br><br> | ||
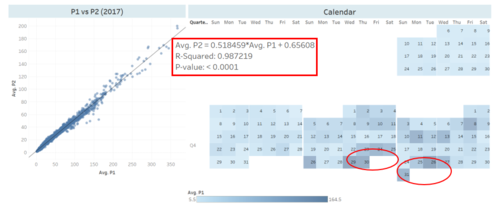
* Firstly, we know that P1 and P2 have a strong positive correlation by exploring the relationship of P1, P2 on those data points recorded hourly. The Treemap tells us that the Geohash “sx8derj5kqf” has the highest pollution both on P1 and P2, so we keep this sensor only in the Calendar heatmap. By zooming into this specific location on air pollution, the differences in the relatively higher readings are time dependent because the concentration ranges on P1 and P2 become larger from Sep to Dec in 2017 and the average readings are extremely high during the days from 5th to 12th in December. | * Firstly, we know that P1 and P2 have a strong positive correlation by exploring the relationship of P1, P2 on those data points recorded hourly. The Treemap tells us that the Geohash “sx8derj5kqf” has the highest pollution both on P1 and P2, so we keep this sensor only in the Calendar heatmap. By zooming into this specific location on air pollution, the differences in the relatively higher readings are time dependent because the concentration ranges on P1 and P2 become larger from Sep to Dec in 2017 and the average readings are extremely high during the days from 5th to 12th in December. | ||
Latest revision as of 09:31, 18 November 2018
Contents
Spatio-temporal Analysis of Citizen Science Air Quality Measurements
Methodology
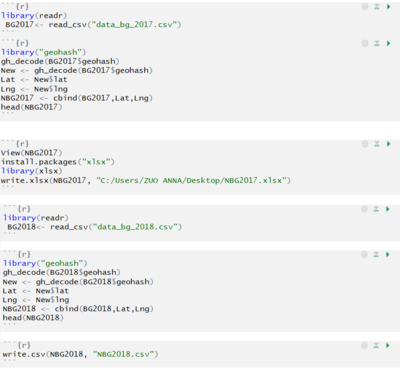
Data Preparation
| Description | Illustration |
|---|---|
|
Insights & Dashboard Design
Characterize the Sensors’ Coverage, Performance and Operation
| Description | Dashboard Visualization |
|---|---|
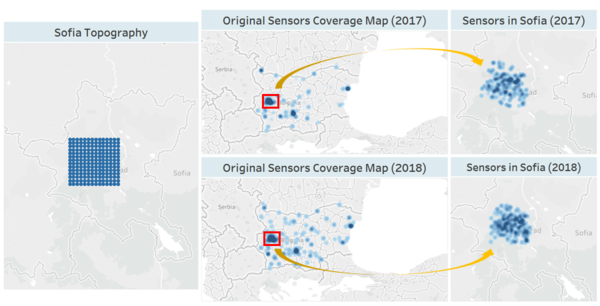
Coverage—Sensors are not only distributed over the Sofia City
|
|
| Performance—Not all the sensors perform well at any time
The dashboard above provides more information on the timeseries for each sensor in 2017.
|
|
Operation
|
Air Pollution Measurements
Which part of the city shows relatively higher readings than others?
| Description | Dashboard Visualization |
|---|---|
Sensors in Year 2017
|
|
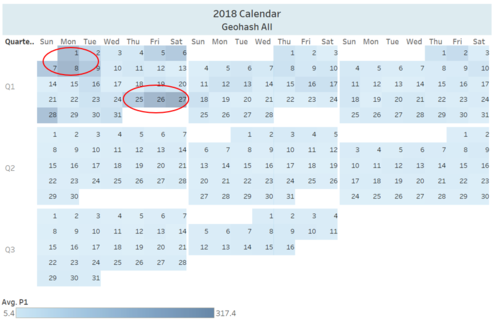
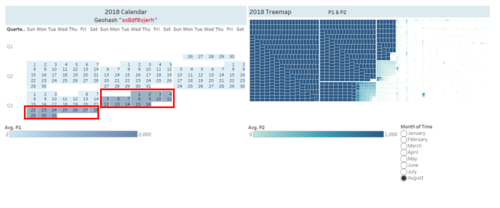
Sensors in Year 2018
|
