Difference between revisions of "ISSS608 2018-19 T1 Assign Zuo Anna Task 2"
Jump to navigation
Jump to search
| Line 57: | Line 57: | ||
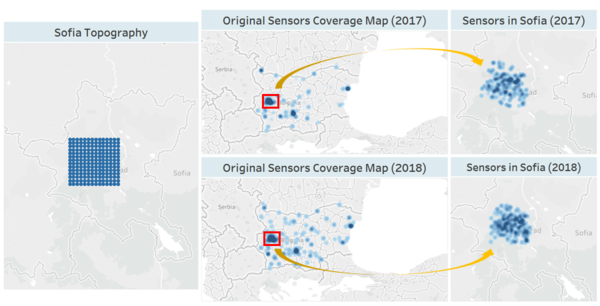
* From the view of the group of maps in the dashboard showed below, both the Original Sensors Coverage Maps in 2017 and 2018 are located over the Bulgaria country rather than only for the Sofia City. Hence, we need to filter out the geohash codes that are out of Sofia City by referring to the sofia_topo dataset which includes Sofia urban area and some areas nominally external to the city (toward Vitosha mountain, note large elevation numbers), although it has no particular effort to include entirety of Sofia Capital's area as per administrative boundaries. <br><br> | * From the view of the group of maps in the dashboard showed below, both the Original Sensors Coverage Maps in 2017 and 2018 are located over the Bulgaria country rather than only for the Sofia City. Hence, we need to filter out the geohash codes that are out of Sofia City by referring to the sofia_topo dataset which includes Sofia urban area and some areas nominally external to the city (toward Vitosha mountain, note large elevation numbers), although it has no particular effort to include entirety of Sofia Capital's area as per administrative boundaries. <br><br> | ||
* In the view of the whole Bulgaria country, there are major three areas that have higher concentration on P1 or P2 in these two years and Sofia city is the most serious polluted city in Bulgaria with a larger intense cycle on the deeper blue colour. The other finding is that by comparing the two Original Sensors Coverage Maps in 2017 and 2018, it is easily to notice that there are more sensors captured in 2018 than in 2017 based on the larger number of data points plotted on the maps. Besides, by comparing the two Sensors in Sofia maps in 2017 and 2018, the points are more intense in 2018 than in 2017 which illustrate a situation that the pollution is more series in 2018. | * In the view of the whole Bulgaria country, there are major three areas that have higher concentration on P1 or P2 in these two years and Sofia city is the most serious polluted city in Bulgaria with a larger intense cycle on the deeper blue colour. The other finding is that by comparing the two Original Sensors Coverage Maps in 2017 and 2018, it is easily to notice that there are more sensors captured in 2018 than in 2017 based on the larger number of data points plotted on the maps. Besides, by comparing the two Sensors in Sofia maps in 2017 and 2018, the points are more intense in 2018 than in 2017 which illustrate a situation that the pollution is more series in 2018. | ||
| − | ||[[File:T2Z|600px|center]] | + | ||[[File:T2Z.png|600px|center]] |
|- | |- | ||
| '''Performance—Not all the sensors perform well at any time''' | | '''Performance—Not all the sensors perform well at any time''' | ||
Latest revision as of 18:56, 18 November 2018
|
|
|
|
|
|
|
Contents
Spatio-temporal Analysis of Citizen Science Air Quality Measurements
Methodology
Data Preparation
| Description | Illustration |
|---|---|
|
Insights & Dashboard Design
Characterize the Sensors’ Coverage, Performance and Operation
| Description | Dashboard Visualization |
|---|---|
Coverage—Sensors are not only distributed over the Sofia City
|
|
| Performance—Not all the sensors perform well at any time
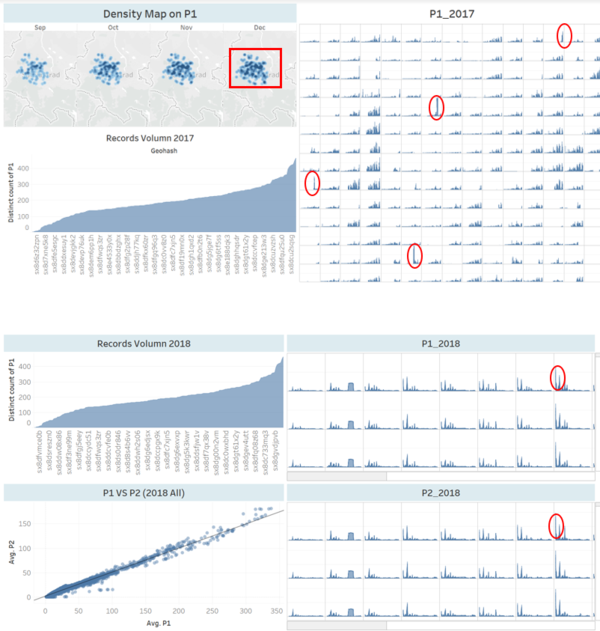
The dashboard above provides more information on the timeseries for each sensor in 2017.
|
|
Operation
|
Air Pollution Measurements
Which part of the city shows relatively higher readings than others?
| Description | Dashboard Visualization |
|---|---|
Sensors in Year 2017
|
|
Sensors in Year 2018
|
