Microheart
Problem Description: According to Data.gov.sg, by 2030, the ageing population in Singapore is projected to reach approximately 90,000, which is almost double of the current ageing population. Therefore, a better understanding of the current ageing population situation and other facilities is needed in order to better prepare for the ageing population.
Motivation: Our motivation is to identify the short term gaps in aspects of the ageing population by providing an insightful data visualization based on the data from singstat and data.gov.sg. We will analyze the current ageing population with respect to the current working population, and the availability of medical care for these aged population. The data visualization will show the distribution of ageing population levels across the planning areas of Singapore (based on URA 2014). Additional information will include presence of medical facilities and working population based on planning areas.
In this project, we aim to create visualisations that helps users perform and analyse the following:
Descriptive
We would like to provide users with up-to-date demographic information, specifically pertaining to the aged population and the distribution across the different areas of Singapore (as per URA 2014). In addition, we would like to include other information, such as the presence of medical facilities and its distribution mapped out on the same planning area chart.
Prescriptive
Based on the suggested design above, we aim to be able to provide users with insights on which certain planning zones or subzones require development and emphasis on medical facilities based on the volume of ageing population staying there.
Predictive
We would like to provide users with a visibility on the trend of ageing population. Based on the dependency ratio formulated from the proportion of ageing population out of the working and economically active population, we aim to be able to predict the timeline on which the ageing situation for the country reaches a critical threshold (where ageing population forms a significant proportion out of the population).
WIP
| Dataset/Source | Data Attributes | Rationale Of Usage |
|---|---|---|
|
WIP |
WIP |
|
WIP
| Related Works | What We Can Learn |
|---|---|
|
|
WIP |
|
WIP | |
|
WIP |
WIP
| Proposed Layout | How Analyst Can Conduct Analysis |
|---|---|
|
WIP |
WIP |
|
WIP |
WIP |
|
WIP |
WIP |
The following are some of the key technical challenges that we may face throughout the course of the project:
| Key Technical Challenges | How We Propose To Resolve |
|---|---|
|
Explore more on D3.js and understand how it works through available resources such as GitHub etc | |
|
Research on the data required, understand which data set is most important and clean up the data | |
|
Explore the possible ways of visualizing data by researching on the existing charts, graphs etc |
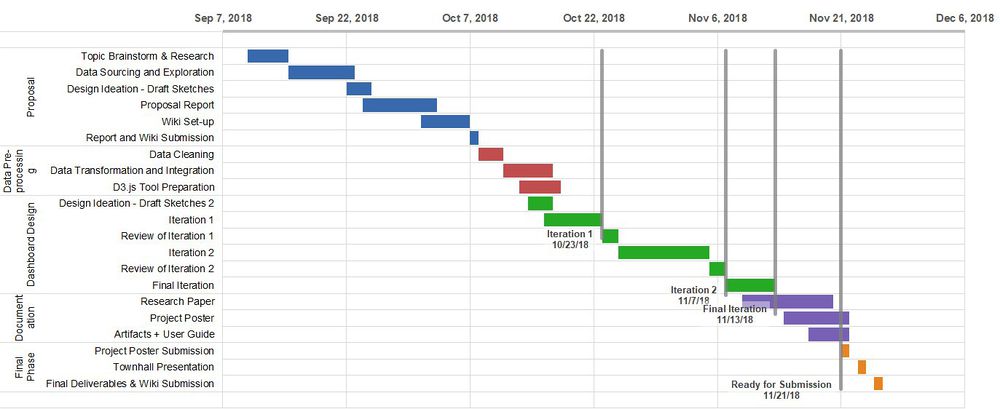
The following shows our project timeline for the completion of this project:
The following are some of the tools/technologies that we will be utilizing during the project:
- Excel
- Tableau
- D3.js
- JMP Pro
WIP
Feel free to provide us with comments, suggestions and feedback to help us improve our project! (:

