IS428 2018-19 T1 Assign Koh How Han Vincent
Contents
Problem & Motivation
Air pollution is an important risk factor for health in Europe and worldwide. A recent review of the global burden of disease showed that it is one of the top ten risk factors for health globally. Worldwide an estimated 7 million people died prematurely because of pollution; in the European Union (EU) 400,000 people suffer a premature death. The Organisation for Economic Cooperation and Development (OECD) predicts that in 2050 outdoor air pollution will be the top cause of environmentally related deaths worldwide. In addition, air pollution has also been classified as the leading environmental cause of cancer.
Air quality in Bulgaria is a big concern: measurements show that citizens all over the country breathe in air that is considered harmful to health. For example, concentrations of PM2.5 and PM10 are much higher than what the EU and the World Health Organization (WHO) have set to protect health.
Bulgaria had the highest PM2.5 concentrations of all EU-28 member states in urban areas over a three-year average. For PM10, Bulgaria is also leading on the top polluted countries with 77 μg/m3on the daily mean concentration (EU limit value is 50 μg/m3).
According to the WHO, 60 percent of the urban population in Bulgaria is exposed to dangerous (unhealthy) levels of particulate matter (PM10).
Dataset Analysis & Transformation Process
Dataset Analysis
| Dataset | Data Description | Observation |
|---|---|---|
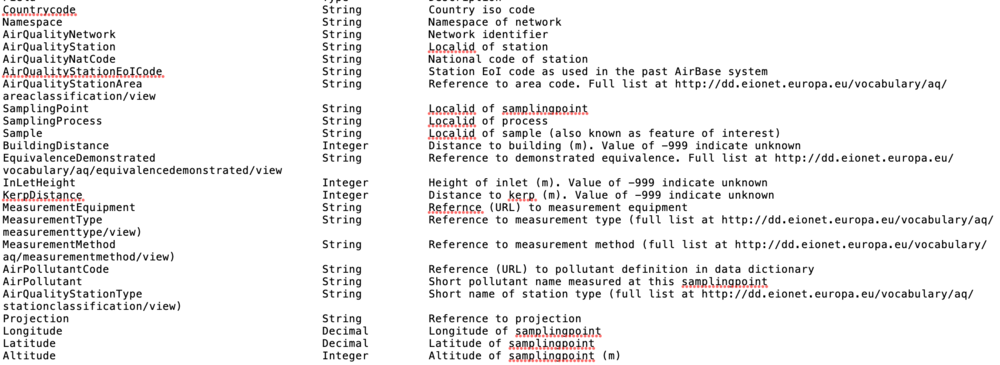
| EEA Data.zip |
Content of EEA Metadata of EEA |
|
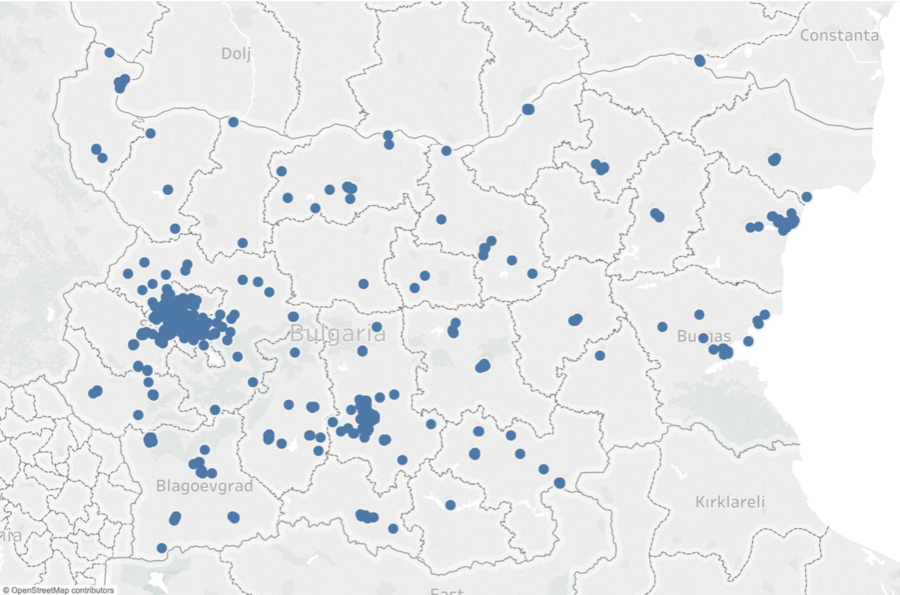
| Air Tube.zip |
| |
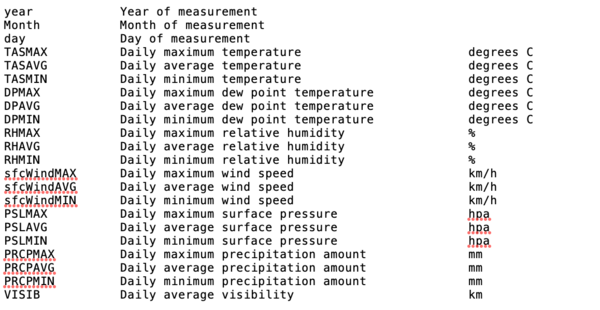
| METEO-data.zip |
| |
| TOPO-DATA.zip |
|
Transformation Process
Official air quality measurements
Using various Air Quality Stations around Sofia City from the year 2013 – 2018, Sofia City is able to obtain daily / hourly PM10 concentration readings of air quality (µg/m3)
Issue: Dataset are split into various CSV files based on the air quality station and years. This will make analysis process difficult as data might be required to load in multiple times, causing unnecessary inefficient and possible inaccurate insight drawn.
Solution: Using Python programming language and Pandas library to combine all relevant dataset into one full dataset.
Issue: Incomplete dataset from 2 of the 6 air quality stations, STA-BG0054A and STA-BG0079A.
Solution: Exclude incomplete datasets from merging.
Issue: As dataset are recorded by air quality station and on different year, the period of recording is on different scale (example: certain year contains both day and hourly data). As such, this will cause inaccurate insight being drawn out. In addition, there are plans to benchmark data using EC air quality standards which is only shown in daily or yearly.
Solution: As daily data could not be drill down further to hourly / var, I will adopt the method of drill up by taking the daily mean instead of hourly / var (daily mean = sum of hourly recorded data per day / number of rows of per day).
Citizen science air quality measurements
Issue: Dataset does not provide any latitude or longitude data, instead, only Geohash data are provided. As Tableau is unable to interpret Geohash data, decoding must be perform to retrieve the latitude and longitude data.
Solution: Using Python programming language and pygeohash library to decode and retrieve latitude and longitude of the location.
Issue: Dataset are split into various CSV files based on the air quality station and years. This will make analysis process difficult as data might be required to load in multiple times, causing unnecessary inefficient and possible inaccurate insight drawn.
Solution: Using Python programming language and Pandas library to combine all relevant dataset into one full dataset.
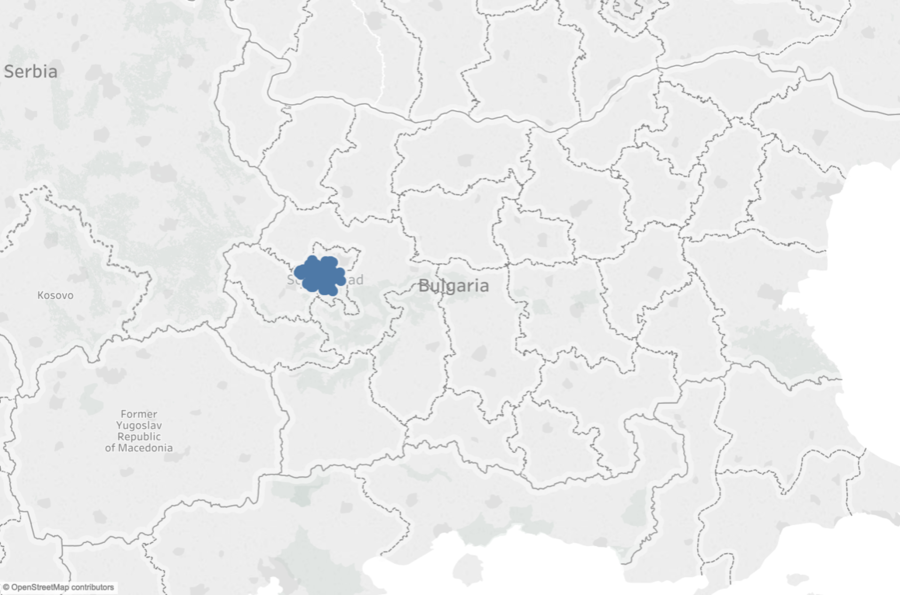
Issue: Dataset contains data outside of Sofia City
Solution: Manually high and exclude data that are outside of Sofia City.
Meteorological measurements (1 station)
Issue: Dataset contain day, month and year separately.
Solution: Make use of Tableau MAKEDATE() to form the date variable. With the date variable, visualization can perform drilldown properly.
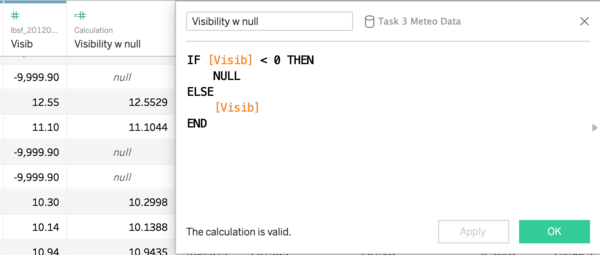
Issue: Visibility contains negative value which represent missing values in the dataset. However, this could cause potential shift in scale during visualization.
Solution: Change all values than is less than 0 to null

