IS428 AY2018-19T1 Ahmad Saifullah Bin Mustaffa
To be a Visual Detective
Contents
Overview
Air pollution is an important risk factor for health in Europe and worldwide. A recent review of the global burden of disease showed that it is one of the top ten risk factors for health globally. Worldwide an estimated 7 million people died prematurely because of pollution; in the European Union (EU) 400,000 people suffer a premature death. The Organisation for Economic Cooperation and Development (OECD) predicts that in 2050 outdoor air pollution will be the top cause of environmentally related deaths worldwide. In addition, air pollution has also been classified as the leading environmental cause of cancer.
Air quality in Bulgaria is a big concern: measurements show that citizens all over the country breathe in air that is considered harmful to health. For example, concentrations of PM2.5 and PM10 are much higher than what the EU and the World Health Organization (WHO) have set to protect health.
Bulgaria had the highest PM2.5 concentrations of all EU-28 member states in urban areas over a three-year average. For PM10, Bulgaria is also leading on the top polluted countries with 77 μg/m3on the daily mean concentration (EU limit value is 50 μg/m3).
According to the WHO, 60 percent of the urban population in Bulgaria is exposed to dangerous (unhealthy) levels of particulate matter (PM10).
Dataset Analysis & Transformation Process
| Problem #1 | Building Data |
|---|---|
| Issue | The official air quality measurement readings (EEA data) do not include the longitude and latitude of the place of measurement. Instead, they are contained in a separate metadata file. |
| Solution | Append all the files together, followed by a left join with the metadata file. This is to assign the respective longitude and latitudes to the all the rows, based on their respective Air Quality Stations. |
| Problem #2 | Transforming Data |
|---|---|
| Issue | The information regarding the air quality measurements in the Air Tube dataset included locations in the form of geocodes. This hindered the mapping out of the stations. |
| Solution | Subject the geocodes to geohashing procedures using R in order to transform the geocode information into longitude and latitude values that could be read by Tableau. |
Task 1
| Spatio-temporal Analysis of Official Air Quality | ||||||
|---|---|---|---|---|---|---|
|
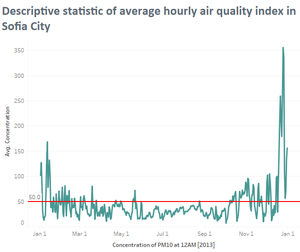
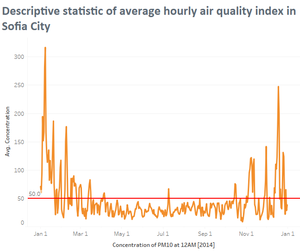
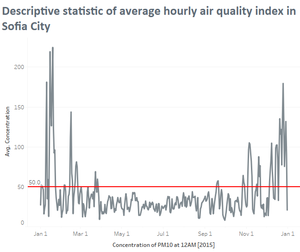
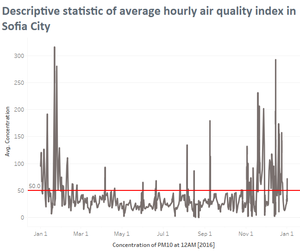
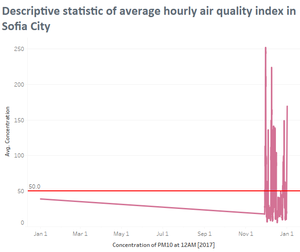
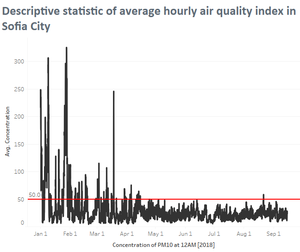
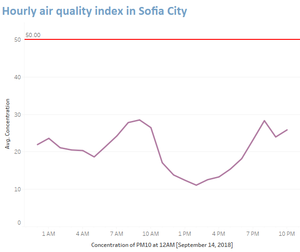
Throughout the years 2013-2016, the concentration of the PM10 pollutant remained within the acceptable standards and only spiked during the early and latter parts of the year i.e. in January and late December. This shows that in general (and only based on levels of PM10), Sofia City’s air quality was acceptable. This trend, however, did not apply to 2017 in which case all readings were well below the concentration limit except for the year-end. This is cause for investigation into what might have happened in early 2017 to curb the city’s pollution level. Also more recently in 2018, the high levels of PM10 have extended into March instead of being confined to January. This might be cause for concern for the government of Bulgaria. More recent hourly trends are as follows: The concentration level of PM10 follows a wave form -- dipping early in the day and afternoon, while rising in the late morning and at night.
|
Task 2
| Spatio-temporal Analysis of Citizen Science Air Quality Measurements |
|---|
|
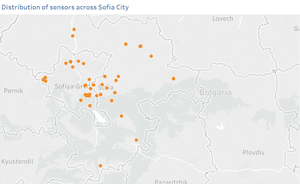
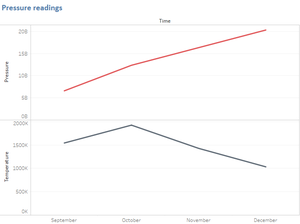
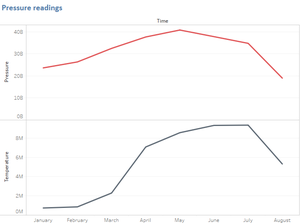
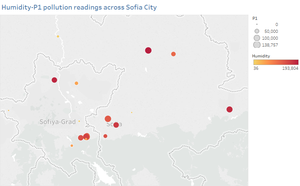
In general, the sensors are not well/evenly spread out across Sofia City but are rather clustered towards the city centre. This obviously distorts the accuracy of generalisations made regarding the scientific measures across Sofia City. Between October - December 2017, the pressure readings did not demonstrate a direct relationship with the temperature readings. The pressure readings were rising whereas the temperature was falling. This might be an indication that during this period, the sensors were faulty. Higher levels of the pollutant P1 were also detected in regions that were relatively more humid. This trend applied to both years as well as both pollutants P1 and P2. |
Task 3
| Tackling Urban Air Pollution |
|---|
|
As seen in Task 1, we gathered that the PM10 concentration levels are relatively higher during between December-January. This coincides with Sofia City's winter season where households would understandably consume more energy (including the burning of fossil fuels) for heating purposes. |
