IS428 2018-19 T1 Assign YeoQinYingSheryl
Contents
Problem & Motivation
Air pollution is an important risk factor for health in Europe and worldwide. A recent review of the global burden of disease showed that it is one of the top ten risk factors for health globally. Worldwide an estimated 7 million people died prematurely because of pollution; in the European Union (EU) 400,000 people suffer a premature death. The Organisation for Economic Cooperation and Development (OECD) predicts that in 2050 outdoor air pollution will be the top cause of environmentally related deaths worldwide. In addition, air pollution has also been classified as the leading environmental cause of cancer.
Air quality in Bulgaria is a big concern: measurements show that citizens all over the country breathe in air that is considered harmful to health. For example, concentrations of PM2.5 and PM10 are much higher than what the EU and the World Health Organization (WHO) have set to protect health.
Bulgaria had the highest PM2.5 concentrations of all EU-28 member states in urban areas over a three-year average. For PM10, Bulgaria is also leading on the top polluted countries with 77 μg/m3on the daily mean concentration (EU limit value is 50 μg/m3).
According to the WHO, 60 percent of the urban population in Bulgaria is exposed to dangerous (unhealthy) levels of particulate matter (PM10).
Given the current poor air quality state in Bulgaria, there is a need build a data visualisation to efficiently identify the spatio-temporal patterns in Sofia City and raise the issues of concern. In view of this, it will assist the Government to come up with measures to help alleviate and mitigate the current problem. Utlimately, being a win-win situation for both the city and its citizens.
Dataset Analysis & Transformation Process
There were four different datasets given for this assignment and this section will illustrate the data analysis and transformation process for each dataset to prepare data for import and visualization.
EEA Data - Official Air Quality Measurements
The data is captured by various Air Quality Stations placed around Sofia City from 2013-2018 to gauge the daily and hourly concentration readings of the Air Quality, measured by µg/m3.
The following are some issues faced:

Issue: Missing/Incomplete dataset from 2 Air Quality Stations (BG_5_9484 and BG_5_60881) Unable to analyse the Air Quality Stations with others to draw any insightful trends. Solution: Exclude incomplete datasets from visualization.
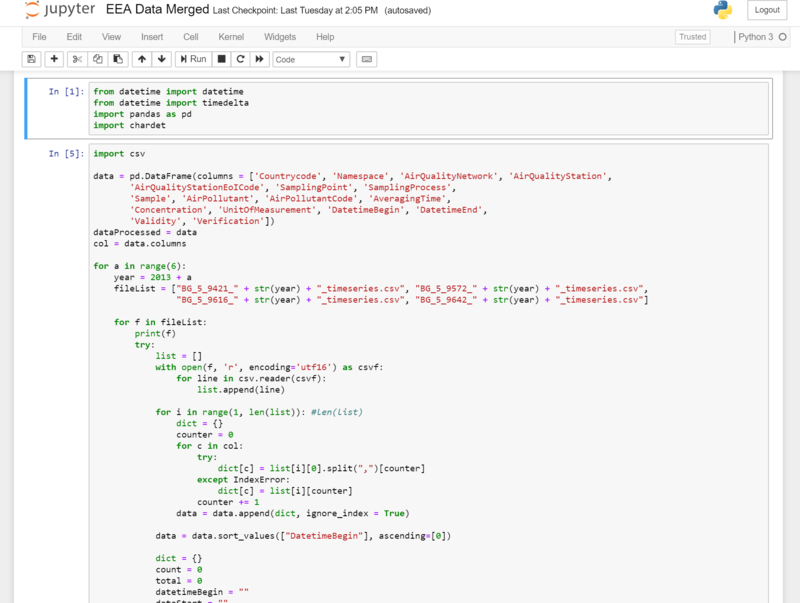
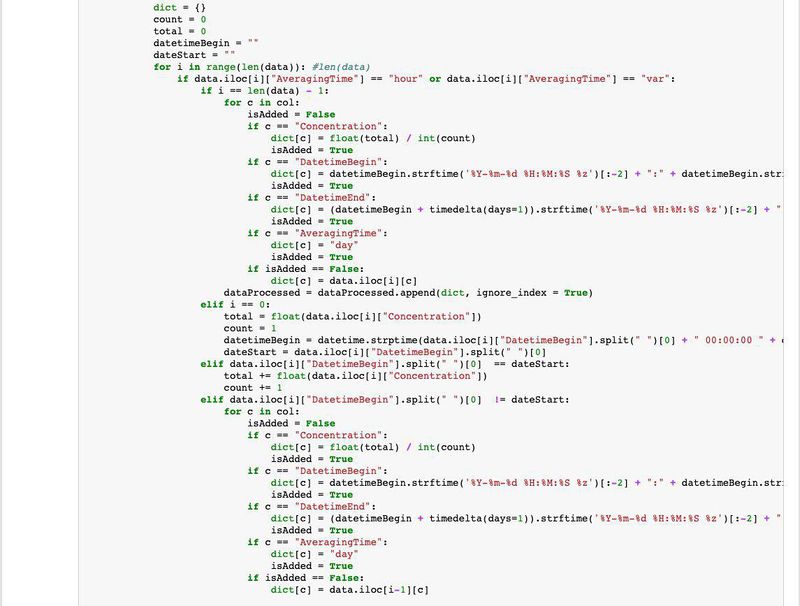
Issue: Currently data are all separated into different sheets in its respective years and air quality stations. This makes analysis difficult, hence the need to join all data together. Solution: Use Python (Pandas Library) to combine all data sets into one single file.
Issue: Dataset’s Averaging Time is not constant. Some stated as “Daily”, some stated as “Hourly”, some stated as “var”. Visualization will not be accurate as data will be inconsistent if compared with EU air quality standards, the average is only shown in daily (50 µg/m3) and yearly (40 µg/m3).
Solution: Filter out the ones in hourly and var. Sum the total and average it.
Air Tube - Citizen Science Air Quality Measurements
Issue: Geographical Location is given in Geohash format. Visualisation Software unable to read.
Solution: Use pygeohash library to retrieve the lat and long of the geographical location.
Issue: Currently data are all separated into different sheets in its respective years, hence the need to join all data together. Solution: Use Python (Pandas Library) to combine all data sets into one single file.
Dataset Import Structure & Process
After analyzing and transforming the data, the transformed files will be imported to Microsoft Power BI.
Task 1 - Spatio-temporal Analysis of Official Air Quality
According to the European Court of Auditors, Sofia City had no projects thus far to target its high emission rates from domestic heating (solid fuel heating) which is the main contributor to particulate matter emissions. Apart from that, transport is another main source contributing to the massive air pollution in Sofia City. The combination of temperature inversion with all these heating during winter caused air pollution to exacerbate.
It has currently no “industrial” monitoring stations to monitor the power plants and industrial facilities in the area. There used to be one station which is used to record the concentration limits, however due to construction works, it got relocated and concentration limits dropped drastically. Does something smell fishy here?

