IS428 AY2018-19T1 Kung Jung-wen
Contents
Problem & Motivation
Dataset Transformation Process
Before starting with the analysis in Tableau, each feature within the data set is being analysed to better understand the context of the problem and to ensure that the data transformation process is performed accurately.
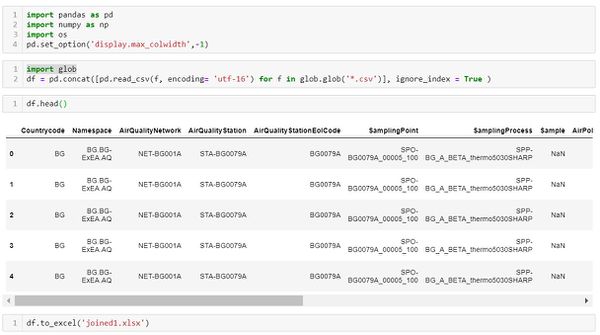
Working with EEA Data: 1. Merge all the EEA air quality data: As there are 28 csv files being provided from the data source, we first combining all the data within python.
2. All the CSV files provided contains the air quality station identifiers, air pollution measurement, time period of measurement and other links. To obtain the geographic location of each air station, we then merged the data with metadata using left merge in Python to obtain mainly the longitude and latitude points of each station. and o change date variable to a format that tableau can read 3. merge with another Challenge Identified:
Solution:
Dataset Import Structure & Process
Interactive Visualization
The interactive visualization can be accessed here: https://public.tableau.com/viws/Assignment3_145/Home?:embed=ey&:display_count=yes
| Interactive Technique | Rationale | Brief Implementation Steps |
|---|---|---|
The use of checkboxes or dropdown list requires the analyst to check/uncheck each date manually which is time-consuming. As such, a time range slider is preferred. |
| |
Use of a drop down list also allow analysts to easily choose the building level that they are interested to analyse. |
| |
When a user filters from one floor to another, the floor plan also changes to provide for quick and easy reference. Due to the space constraint, each floor plan has to be zoomed for users to identify and see the zone areas clearly. |
|
Interesting & Anomalous Observations
Using the dashboard as a platform for investigation and analysis, the following aims to provide answers to the questions posed.
Q1: Typical Patterns In Proximity Card Data & Typical Day Of GAStech Employees
Typical Patterns in Proximity Card Data
Based on the data captured by the proximity sensors, the following shows a typical pattern in the proximity card data.
- For the fixed proximity sensors, readings are collected for 24hours during the weekdays, except for 1am and 4am. From 12midnight to 6am, only level 1 fixed proximity sensor will collect data. This can possibly mean that there is no employee movement from 12midnight to 6am on level 2 and 3.
- For the mobile proximity sensor, Rosie (the mobile robot) travels the halls at 9am and 2pm daily. On 4, 5, 11 and 12 June, the robot does not collect any readings. One possible reason is that these are weekends (Sat/Sun) and therefore, Rosie will not be required to travel along the hallways.
Typical Day for GAStech Employees
The following lists a typical day for GAStech employees, in all departments:
- Employees start arriving in the office at 7am. By 9am, majority of the employees would have already arrived in the building and settle in their own office space.
- Lunch time is usually between 12nn to 2pm.
- At around 2pm, many employees will be back in their office and that’s when we can see lots of activities going on in the different levels.
- Employees typically end work at around 5pm, though some may leave slightly earlier.
- After 6pm, majority of the employees in the office are from the Engineering, Facilities and IT department.
- After 7pm, employees working in level 3 would have left the office.
- At 12midnight, most of the employees would have left the building and only people in the facilities team will be present in level 1.
- People in the facilities department will be available in the building 24 hours and its always the same people patrolling around the area.
- Other than the facilities personnel, IT and engineering employees often stay in the office and will only leave at around 12midnight.
The following lists some activities that is part of a typical day pattern for employees in a specific department:
| Department | Activities |
|---|---|
| |
| |
| |
| |
|
