IS428 AY2018-19T1 Wang Sheng
Contents
Problem & Motivation
Air pollution is an important risk factor for health in Europe and worldwide. A recent review of the global burden of disease showed that it is one of the top ten risk factors for health globally. Worldwide an estimated 7 million people died prematurely because of pollution; in the European Union (EU) 400,000 people suffer a premature death. The Organisation for Economic Cooperation and Development (OECD) predicts that in 2050 outdoor air pollution will be the top cause of environmentally related deaths worldwide. In addition, air pollution has also been classified as the leading environmental cause of cancer.
Air quality in Bulgaria is a big concern: measurements show that citizens all over the country breathe in air that is considered harmful to health. For example, concentrations of PM2.5 and PM10 are much higher than what the EU and the World Health Organization (WHO) have set to protect health.
Bulgaria had the highest PM2.5 concentrations of all EU-28 member states in urban areas over a three-year average. For PM10, Bulgaria is also leading on the top polluted countries with 77 μg/m3on the daily mean concentration (EU limit value is 50 μg/m3).
According to the WHO, 60 percent of the urban population in Bulgaria is exposed to dangerous (unhealthy) levels of particulate matter (PM10).
Dataset Analysis & Transformation Process
Before analyzing the data, there is a need to do data preparation to make sense of the data. Under the Sofia Air data, there are 4 different zip files provided in the assignment with each own unique ways to process and make sense of the data. This particular section will be used to elaborate on the dataset analysis and its transformation process for each dataset, to prepare the data for import and analysis onto tableau.
We are provided with 4 different zip files of data covering all aspects of measures. A good understand on the data content will definitely help us on analyzing the problem. This particular section will be used to elaborate on the dataset analysis and the data transformation needed to be done for all the datasets.
Datasets
- Official air quality measurements (5 stations in the city)(EEA Data.zip) – as per EU guidelines on air quality monitoring see the data description HERE…
- Citizen science air quality measurements (Air Tube.zip) , incl. temperature, humidity and pressure (many stations) and topography (gridded data).
- Meteorological measurements (1 station)(METEO-data.zip): Temperature; Humidity; Wind speed; Pressure; Rainfall; Visibility
- Topography data (TOPO-DATA)
Data transformation
Before start analyzing the data, we notice that the data are not readily prepared to be analyzed by data visualization softwares due to following problems:
Problem 1. Time columns are stored in different formats in different data files
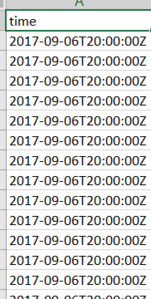
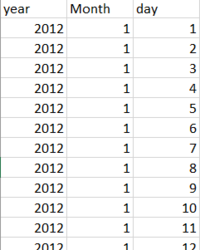
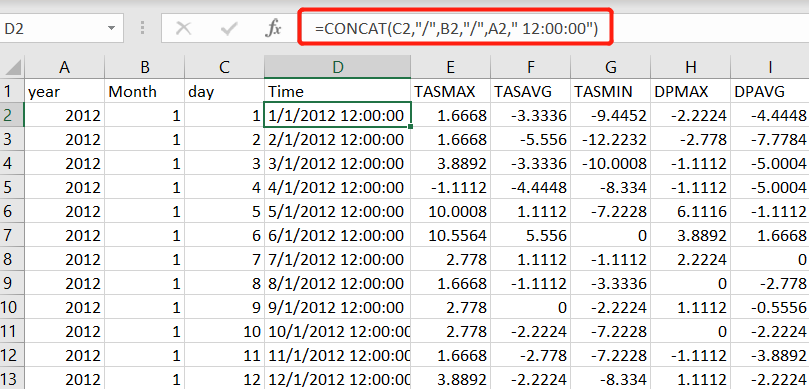
* Time in Air Tube data are stored with format "dd/mm/yyyy hh:mm:ss". However, Time in METO-data are stored in separate columns
Solution 1. Time columns are stored in different formats in different data files
* Re-structure the time format in METEO Data and add additional column in the Excel file
* Join the two data sets according to the same time value
Problem 2. Some years data are missing for EEA data
* As show in figure below, this station doesn't have data after year 2015
Solution 2. Use these datasets selecively
  * Can use theses data to state the reliability of the sensors
  * Do not use these data for calculation of average value of measures
Problem 3. Tableau is unable to understand geohash data
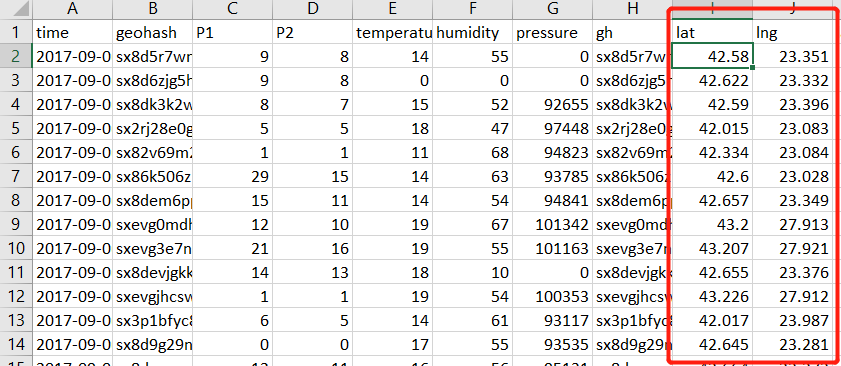
* In Air Tube data, location of sensors are stated in geohash format. However, Tableau can not understand geohash value and thus unable to display the geographical locations on the map.
Solution 3. Data tranformation on geohash data
* Use R package to transform the geohash data to coordinates and store in new columns
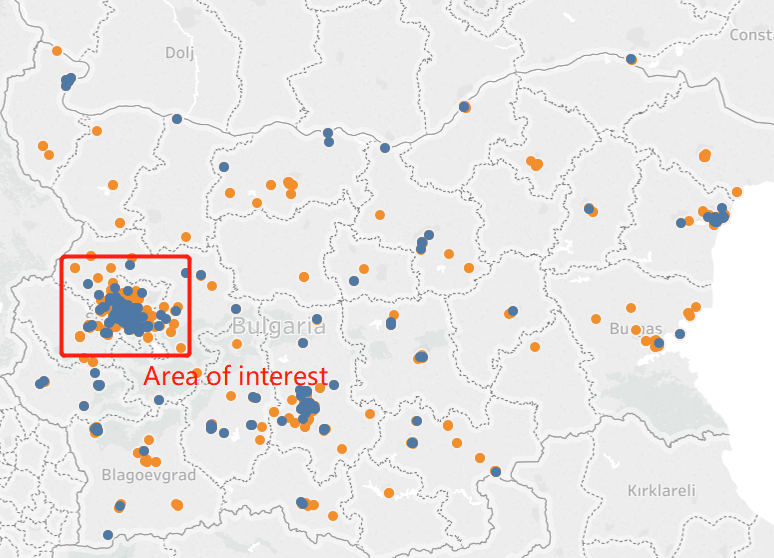
Problem 4. Data provided is beyond our area of interest
  * According to the data and geohash provided, we can get the location of each sensor.
  * However, we only interest those in Sofia's city area. Area is provided in TOPO data
Solution 4. Filter the unnecessary data
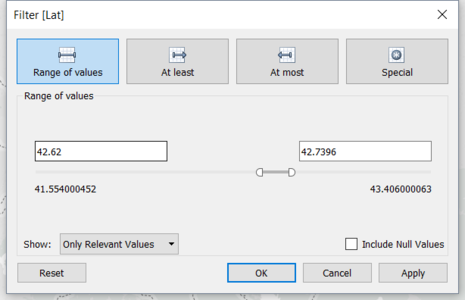
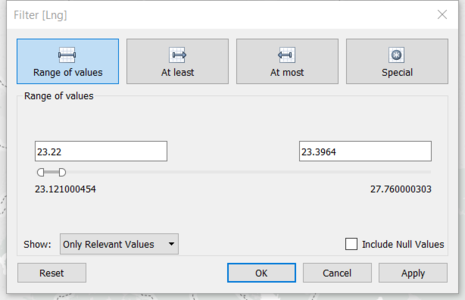
* Within Tableau, filter out the uninterested data using filters
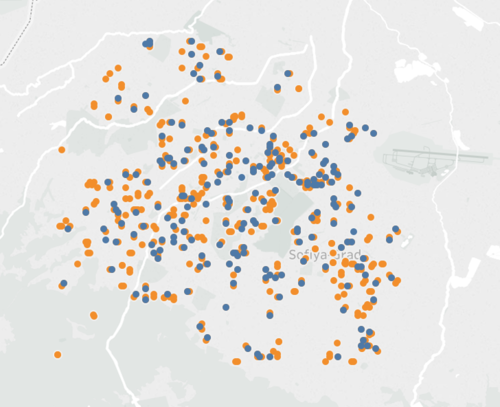
* Data after filtering
The Task
Use the transformed data, we can concluded following answers supported with appropriate visualizations
Task 1: Spatio-temporal Analysis of Official Air Quality
| Typical day in Sofia city |
|---|
|
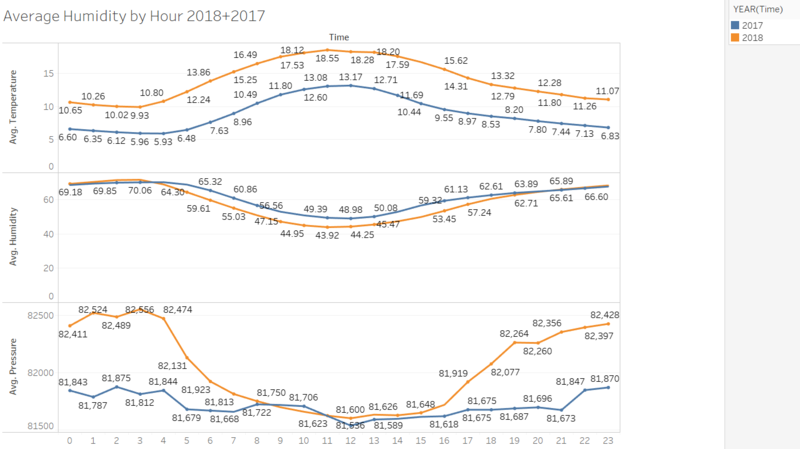
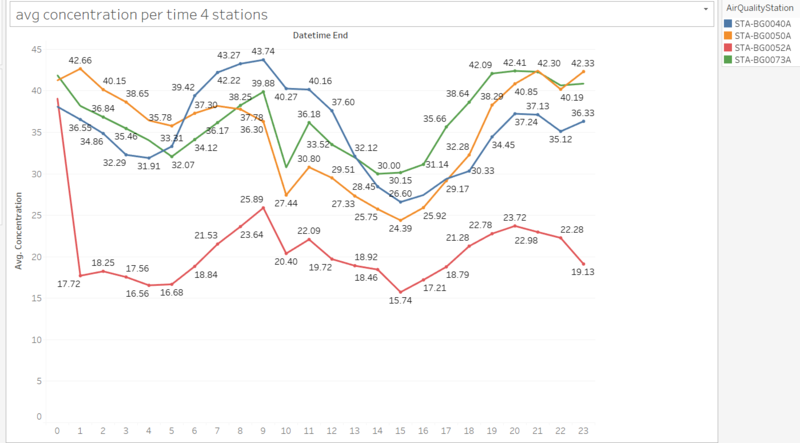
The daily measures from 00:00 - 23:00 are stated as below.
|
| Typical day in Sofia City
1. Average temperature of a day generall start low(around 10 degree Celsius) and rises until 12 pm, then it generally goes down.
|
| Trends of possible interests |
|---|
|
|
| Trends & Interests
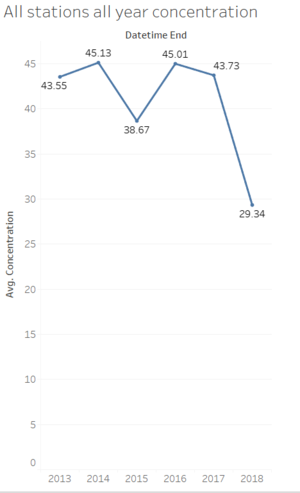
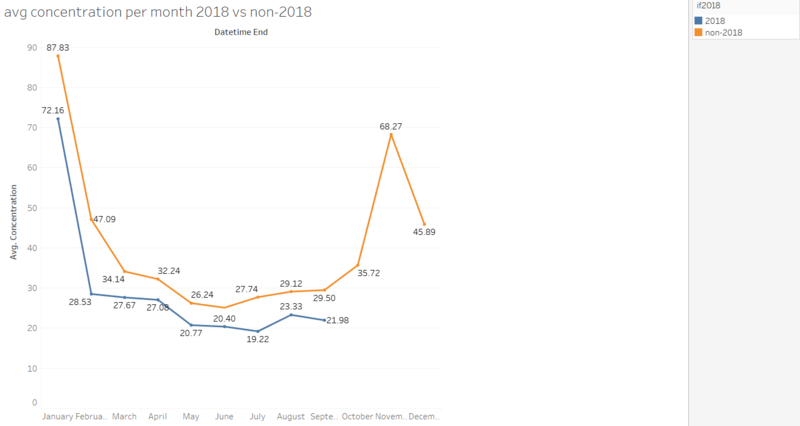
1.As shown in the pollutant concentration by year graph, we can notice that the average pollutant concentration is at the trend of dropping since 2016. Especially from 2017 to 2018, the rate of dropping is very high and the pollutant concentration is the lowerst among observable history. This conclusion is suppported by the following figure:
|
| Anomalies and how do them affect analysis of potential problems to the environment |
|---|
|
The daily measures from 00:00 - 23:00 are stated as below.
|
| Typical day in Sofia City
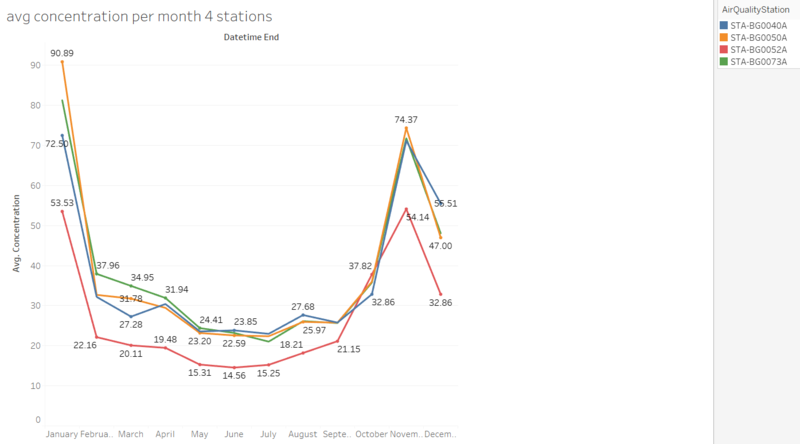
However in December, the concentration value dropped down by a bit but still higher than the rest of the seasons.
|
