Difference between revisions of "IS428 2018-19 T1 Assign Fu Yu"
Yu.fu.2015 (talk | contribs) |
Yu.fu.2015 (talk | contribs) |
||
| Line 59: | Line 59: | ||
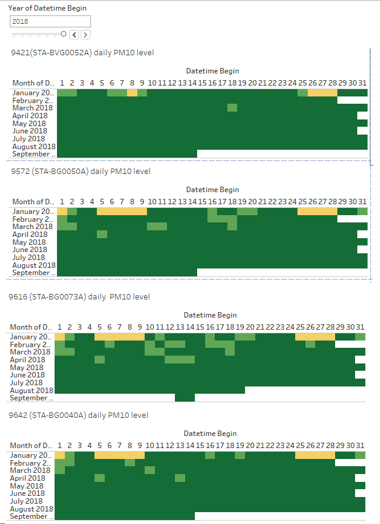
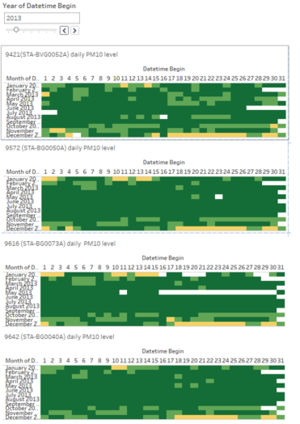
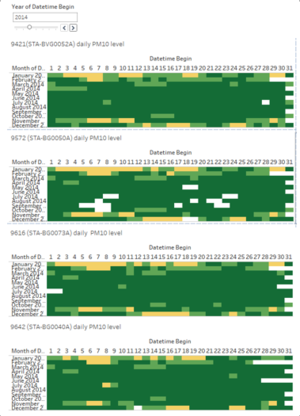
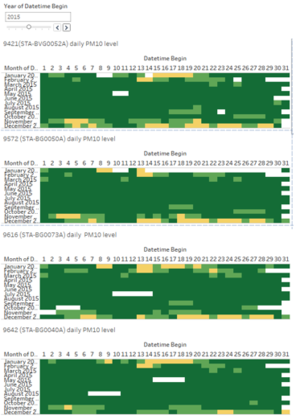
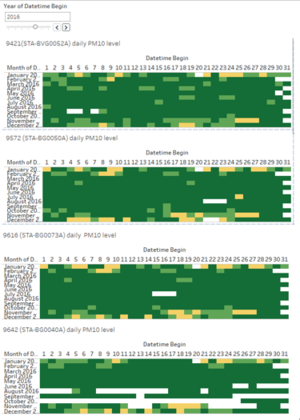
<p>The above graphs display the PM10 concentration in Sofia City from January 2013 to September 2018 where data for 2017 is omitted because there is only November and December data. Dark green indicates good air quality where PM10 concentration <= 50 ug/m3 . Light green indicates satisfactory air quality where 51 ug/m3 < PM10 concentration <=100 ug/m3. Yellow indicates poor air quality where PM10 concentration > 100 ug/m3. Each heatmap represents the air quality of one measured station in Sofia City.</p> | <p>The above graphs display the PM10 concentration in Sofia City from January 2013 to September 2018 where data for 2017 is omitted because there is only November and December data. Dark green indicates good air quality where PM10 concentration <= 50 ug/m3 . Light green indicates satisfactory air quality where 51 ug/m3 < PM10 concentration <=100 ug/m3. Yellow indicates poor air quality where PM10 concentration > 100 ug/m3. Each heatmap represents the air quality of one measured station in Sofia City.</p> | ||
<p> <b>Trends:</b> | <p> <b>Trends:</b> | ||
| − | * Air quality in all the four stations is | + | * Air quality in all the four stations is usually poor at the start and the end of a year. |
* Being the station with fewest days having good air quality in 2013, station STA-BG0052A has the most days with good air quality in 2018 compared with other stations. | * Being the station with fewest days having good air quality in 2013, station STA-BG0052A has the most days with good air quality in 2018 compared with other stations. | ||
| + | |} | ||
| + | {| class="wikitable" style="background-color:#FFFFFF;" width="100%" | ||
| + | |'''1.2 A Typical Day in Sofia City | ||
| + | ''' | ||
| + | [[File:A typical day in sofia city yu.fu.2015.png|center]] | ||
| + | |||
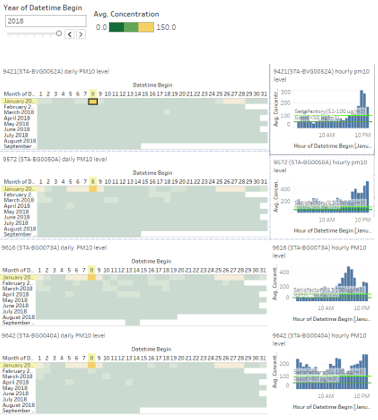
| + | <p>To investigate how PM10 concentrations vary from hours to hours in a day, one can simply highlight a day on the heatmap and the hourly PM10 concentration graphs will update accordingly. For example, as shown in the diagram above, on 8 January 2018, air quality in stations STA-BG0052A and STA-BG0050A is poor after 10pm while air quality in station STA-BG0073A is poor starting from 12pm and in STA-BG0040A, air quality is poor throughout the whole day.</p> | ||
| + | |||
| + | [[File:A typical day in sofia city 2016n2018 yu.fu.2015.png|center]] | ||
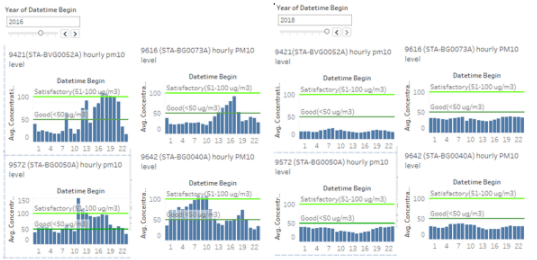
| + | <p>The diagram above display a typical day in 2016 and 2018 respectively. They suggest that air quality in Sofia City has improved from 2016 to 2018.</p> | ||
| + | |||
|} | |} | ||
Revision as of 00:03, 11 November 2018
Contents
Problem & Motivation
Air pollution is an important risk factor for health in Europe and worldwide. A recent review of the global burden of disease showed that it is one of the top ten risk factors for health globally. Worldwide an estimated 7 million people died prematurely because of pollution; in the European Union (EU) 400,000 people suffer a premature death. The Organisation for Economic Cooperation and Development (OECD) predicts that in 2050 outdoor air pollution will be the top cause of environmentally related deaths worldwide. In addition, air pollution has also been classified as the leading environmental cause of cancer.
Air quality in Bulgaria is a big concern: measurements show that citizens all over the country breathe in air that is considered harmful to health. For example, concentrations of PM2.5 and PM10 are much higher than what the EU and the World Health Organization (WHO) have set to protect health.
Bulgaria had the highest PM2.5 concentrations of all EU-28 member states in urban areas over a three-year average. For PM10, Bulgaria is also leading on the top polluted countries with 77 μg/m3on the daily mean concentration (EU limit value is 50 μg/m3).
According to the WHO, 60 percent of the urban population in Bulgaria is exposed to dangerous (unhealthy) levels of particulate matter (PM10).
Dataset Analysis & Transformation Process
Decode the geohash column in Air Tube data files
Geohash tells the station locations. However Tableau is not able to interpret geohash as geographic data. Before Air Tube data is imported to Tableau for analysis, geohash needs to be decoded into geographical coordinates. As the two Air Tube data files- data_bg_2017.xlsx and data_bg_2018.xlsx are of big sizes and there are duplicate geohash records in the data, an Excel file containing a unique geohash list was created.
Step 1: Use "pygeohash" package to decode the geohash list and output the coordinates in an Excel file
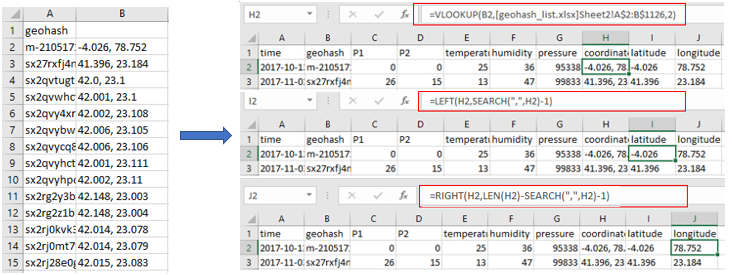
Step 2: Combine geohash list and coordinates list into one Excel file and update the coordinates, latitude, longitude in data_bg_2017.xlsx and data_bg_2018.xlsx using VLOOKUP, LEFT and RIGHT functions in Excel
Dataset Import Structure & Process
Interactive Visualization
Interesting & Anomalous Observations
Task 1: Spatio-temporal Analysis of Official Air Quality
| 1.2 A Typical Day in Sofia City
To investigate how PM10 concentrations vary from hours to hours in a day, one can simply highlight a day on the heatmap and the hourly PM10 concentration graphs will update accordingly. For example, as shown in the diagram above, on 8 January 2018, air quality in stations STA-BG0052A and STA-BG0050A is poor after 10pm while air quality in station STA-BG0073A is poor starting from 12pm and in STA-BG0040A, air quality is poor throughout the whole day. The diagram above display a typical day in 2016 and 2018 respectively. They suggest that air quality in Sofia City has improved from 2016 to 2018. |
